


Abstract
Background: Collectively, the most common acute cardiac presentations to emergency departments are acute coronary syndromes (ACSs) and heart failure. We examined geographic variation and clustering in emergency department presentations by adults for ACS or heart failure in Alberta in 2010/11.
Methods: All emergency department presentations for ACS or heart failure made by Alberta residents aged 35 years or more during 2010/11 were extracted from 5 linked population-based Alberta administrative health databases. Data extracted included demographic characteristics, hospital admissions and physician claims. Spatial scan tests and logistic regression analyses were performed.
Results: There were 6342 patients with ACS (mean age 65.9 yr, 63.1% male) and 4780 patients with heart failure (mean age 76.6 yr, 49.9% male). For both ACS and heart failure, a primary cluster and 2 secondary clusters were identified. Different clusters were identified for the 2 conditions. For both conditions, patients living in the clusters had more primary care physician claims, prior emergency department visits and prior hospital admissions than did patients living outside the clusters. However, they were less likely to have had a specialist claim in the prior 2 years (odds ratio 0.64 [95% confidence interval 0.56-0.73] for ACS and 0.51 [95% confidence interval 0.43-0.61] for heart failure).
Interpretation: Geographic areas were identified with higher numbers than expected of patients presenting to the emergency department for ACS or heart failure. Lower specialist access in these areas was associated with increased emergency department use.
The emergency department is often the initial point of contact with the health care system for patients with new-onset cardiac conditions or exacerbations of chronic cardiac conditions. Collectively, the most common acute cardiac presentations to the emergency department are acute coronary syndromes (ACSs) and heart failure.1 The literature on these important conditions in the emergency department setting in Canada is surprisingly limited. In particular, geographic variation has not received much attention, and such variation may represent greater severity of illness, lesser availability of health care resources, variation in delivery of health care services or a combination of these factors.
The aim of this study was to examine geographic variation in visits by adults (aged ≥ 35 yr) to emergency departments with presentations attributed to ACS or heart failure in Alberta during 2010/11. We have previously identified clusters of patients presenting to the emergency department for atrial fibrillation and flutter2 and wished to further examine geographic variation in cardiac conditions in Alberta.
Methods
Study design and setting
This study is a retrospective cohort study using population-based administrative health databases in Alberta from Apr. 1, 2010, to Mar. 31, 2011.
Sources of data
We extracted data from 5 Alberta administrative health databases: 1) the Morbidity and Ambulatory Care Abstract Reporting for emergency department presentations, 2) the Alberta Health Care Insurance Plan cumulative registry file for population counts and demographic data, 3) the Physician Claims database for physician visits in settings other than the emergency department, 4) the Discharge Abstract Database for acute care hospital admissions and 5) Vital Statistics for death data. Each Albertan has a unique personal health identifier, and we used these identifiers for data linkage. The Morbidity and Ambulatory Care Abstract Reporting database records ambulatory care visits to government-funded facilities and contributes to the National Ambulatory Care Reporting System.3
Each record in the Morbidity and Ambulatory Care Abstract Reporting database represents a single emergency department encounter, and charts are coded with the use of the Canadian enhancement of the International Classification of Diseases and Related Health Problems, 10th Revision (ICD-10-CA)4 diagnosis codes. The database has a main diagnosis field and 9 additional fields for diagnosis data. To be considered a presentation, the first diagnosis field in the database had to match the diagnostic codes for ACS (I20.x, I21.x, I22, I23.82, I24.0, I24.8, I24.9, I25.0, I25.1, I25.6, I25.8, I25.9) or heart failure (I11.0, I50.x, J81). We extracted all emergency department presentations between Apr. 1, 2010, and Mar. 31, 2011 for Alberta residents aged 35 years or more who matched the case definition. We focused on this patient population because events at younger ages often have different causes (e.g., drug/alcohol use) and are infrequent. A patient with ACS or heart failure and an emergency department presentation was defined as a person with at least 1 emergency department visit for ACS or heart failure during the study period. We extracted emergency department data for Apr. 1, 2008, to Mar. 31, 2010 to determine whether a prior history of emergency department presentation for ACS or heart failure existed.
Variables for patients included sex, age, socioeconomic proxy and area of residence at fiscal year end. The Alberta government funds health care in the province, and health care insurance premiums provided partial funding until Jan. 1, 2009. Residents with lower incomes and those receiving social services (e.g., welfare) were eligible for premium subsidies. The subsidy level can be used as a proxy measure for socioeconomic status. In addition, many First Nations people in Alberta have Treaty status based on treaties between their First Nation bands and the Canadian government,5 resulting in full premium subsidies. Combining the categories and age, we created 3 mutually exclusive groups: older adults (people aged ≥ 65 yr), subsidized adults (people aged < 65 yr receiving health care subsidies or who are First Nations) and nonsubsidized adults (people aged < 65 yr who do not receive premium subsidies).
We extracted claims from the Physician Claims database for physician visits in settings other than the emergency department in the 2 years before the index emergency department presentation. The variables were physician specialty, date of visit and 3 diagnostic codes. Diagnoses are coded in this database with the use of the International Classification of Diseases, Ninth Revision, Clinical Modification (ICD-9-CM).6 We used the diagnostic fields to determine a prior history of ACS (410.x, 411.1, 411.8, 413.x, 414.0, 414.8, 414.9, V458.8) or heart failure (402.01, 402.11, 402.91, 428.x, 518.4). We also used the data on physician visits to calculate the Charlson Comorbidity Index based on the Deyo ICD-9-CM coding scheme.7 For each of the prior history and comorbidity variables, 2 or more physician claims in the previous 2 years were required to meet the definitions.8 We also calculated the numbers of claims by general practitioners and specialists (cardiology or internal medicine) in the previous 2 years.
We extracted the dates of hospital admission for any reason in the 2 years before the index emergency department presentation from the Discharge Abstract Database.
We obtained data on deaths within 90 days of an emergency department presentation from Alberta Vital Statistics.
Alberta has 70 subregional health authorities (Figure 1), areas with diverse population sizes.9 They provide well-circumscribed areas within each of the 5 health zones in Alberta from which to draw conclusions and allow for the calculation of stable disease rates.9 Alberta Health previously geocoded data to these areas (numbered 1 to 70) and provided latitude and longitude for population-based centroids.
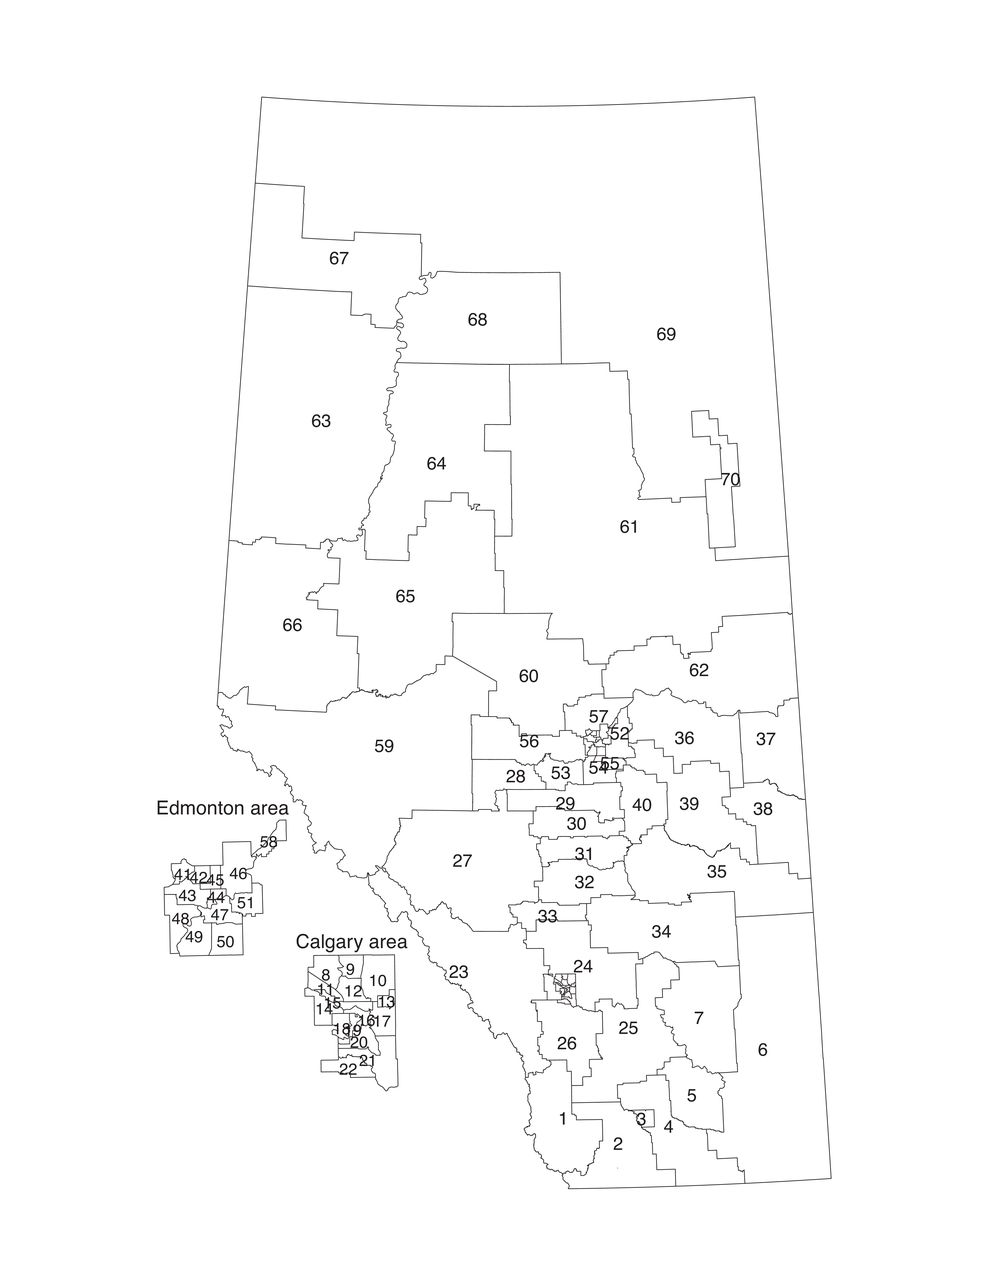
Alberta's 70 subregional health authorities.
Statistical analysis
We calculated numerical summaries (frequency, mean, standard deviation, interquartile range, and crude and sex- and age-group directly standardized rates for ACS and heart failure using R (R Foundation for Statistical Computing).
To identify geographic areas with excess numbers of patients presenting to the emergency department, we used the Kulldorff-Nagarwalla spatial scan test,10 which adjusts for underlying population counts. It is a popular method for identifying clusters.11-15 We performed calculations in SaTScan (www.statscan.org) with a space window of up to 50% of Alberta's population and with sex and age group as strata. The area of residence was used for each patient, and patients for whom area was missing were not included in the analyses. The spatial scan identifies a primary cluster (the most likely cluster that has the highest maximum likelihood ratio and rejects the null hypothesis of no clustering) and any secondary clusters (areas distinct from the primary cluster that have high maximum likelihood ratios that also reject the null hypothesis).10 In general, people living inside identified clusters are at higher risk for a given disease than those living outside the clusters. We report statistically significant (p value < 0.05) primary and secondary clusters.
We created multivariable logistic regression models for the 2 conditions to identify explanatory variables that differed for patients inside the statistically significant clusters. We entered age and sex into the models even though detection was adjusted for age group and sex. Socioeconomic proxy, comorbidity score, prior claims for comorbid conditions (chronic obstructive pulmonary disease, diabetes, hypertension and kidney disease), prior emergency department history of ACS or heart failure, prior history of hospital admission for any reason, prior history of a physician claim for ACS or heart failure, number of physician claims and prior history of a specialist visit were all entered into the multivariable model. Odds ratios (ORs) and 95% confidence intervals (CIs) are provided.
Ethics approval
The Human Research Ethics Board at the University of Alberta approved this study.
Results
Overall, 13 283 emergency department presentations for ACS (n = 7059 [6344 patients]) and heart failure (n = 6224 [4780 patients]) were extracted. Most patients (9213/10 866 [84.8%]) had 1 emergency department presentation, and 258 were identified in both cohorts. Two patients with ACS without area data were excluded. Analyses were thus conducted on data for 6342 patients with ACS and 4780 patients with heart failure.
Compared to the heart failure group, the ACS group had more men, was younger, had fewer hospital admissions and had fewer physician claims, and fewer had had a prior specialist visit (Table 1). Within 90 days of the emergency department visit, 340 (5.4%) and 821 (17.2%) patients had died in the ACS and heart failure groups, respectively. Overall, the crude rates of patients with at least 1 emergency department presentation were 3.25 per 1000 (95% CI 3.17-3.33) for ACS and 2.45 per 1000 (95% CI 2.38-2.52) for heart failure. When adjusted for sex and age group, the directly standardized rates ranged from 1.67 per 1000 (95% CI 1.27-2.15) to 7.98 per 1000 (95% CI 4.63-15.10) for ACS (Figure 2). For heart failure, the directly standardized rates ranged from 0.68 per 1000 (95% CI 0.36-1.18) to 6.79 per 1000 (95% CI 5.16-8.96) (Figure 3). The regions with the highest and lowest directly standardized rates were different for ACS and heart failure.
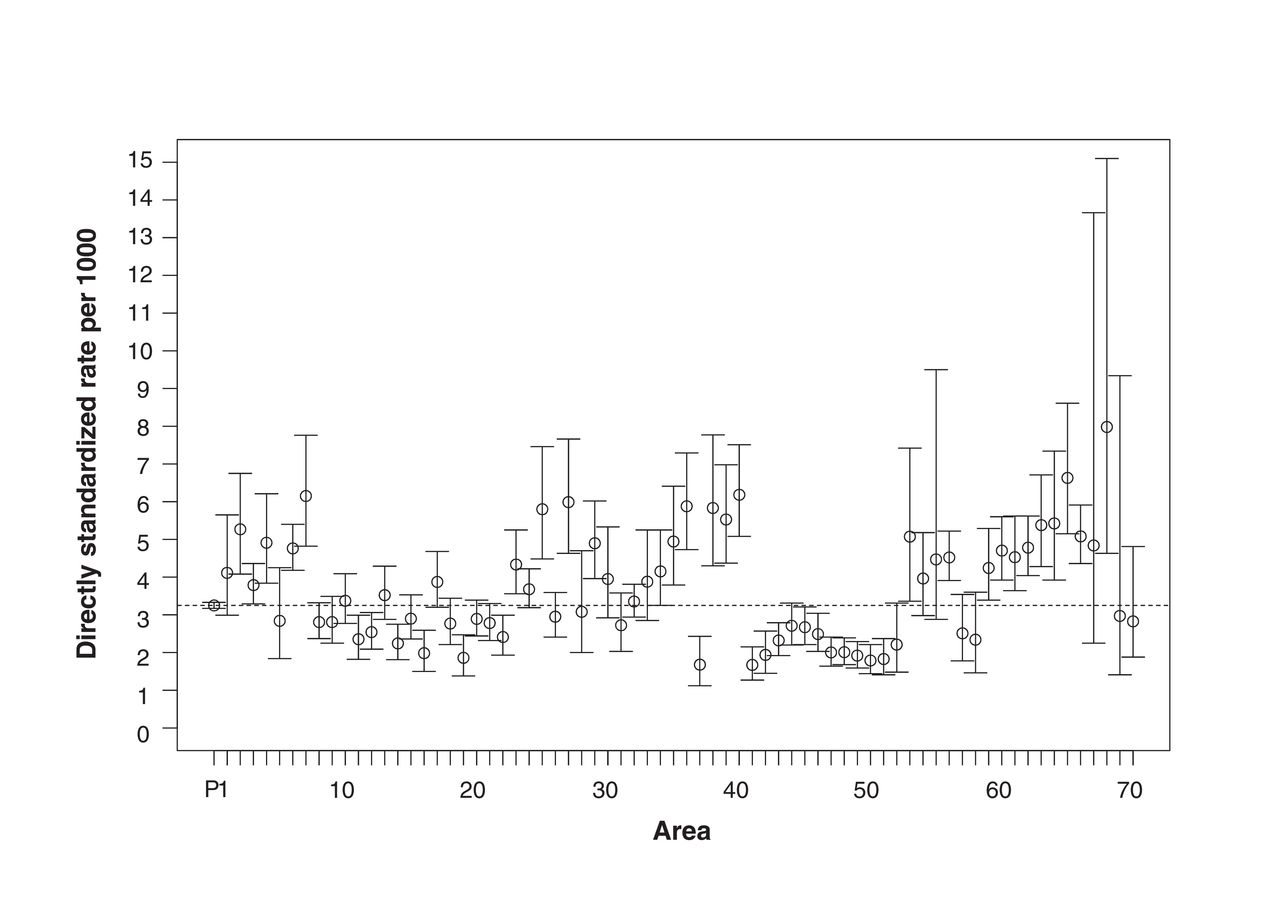
Age-group- and sex-adjusted directly standardized rates per 1000 (and 95% confidence intervals) for acute coronary syndromes by area. P denotes entire province. Dotted line denotes provincial rate.

Age-group- and sex-adjusted directly standardized rates per 1000 (and 95% confidence intervals) for heart failure by area. P denotes entire province. Dotted line denotes provincial rate.
Geographical clustering
Acute coronary syndromes
Clusters of higher numbers than expected of patients presenting to the emergency department for ACS were identified in the northwest (cluster 1, [primary cluster]), central east (cluster 2) and south (cluster 3) (Table 2, Figure 4). Cluster 1 had 926 observed patients, compared to 619.43 expected, adjusted for age group and sex distribution. With an observed to expected ratio of 1.49 and a relative risk of 1.58, this collection of areas was the most likely cluster (p < 0.001). Clusters 2 and 3 had relative risks of 1.76 and 1.47, respectively (both p < 0.001).
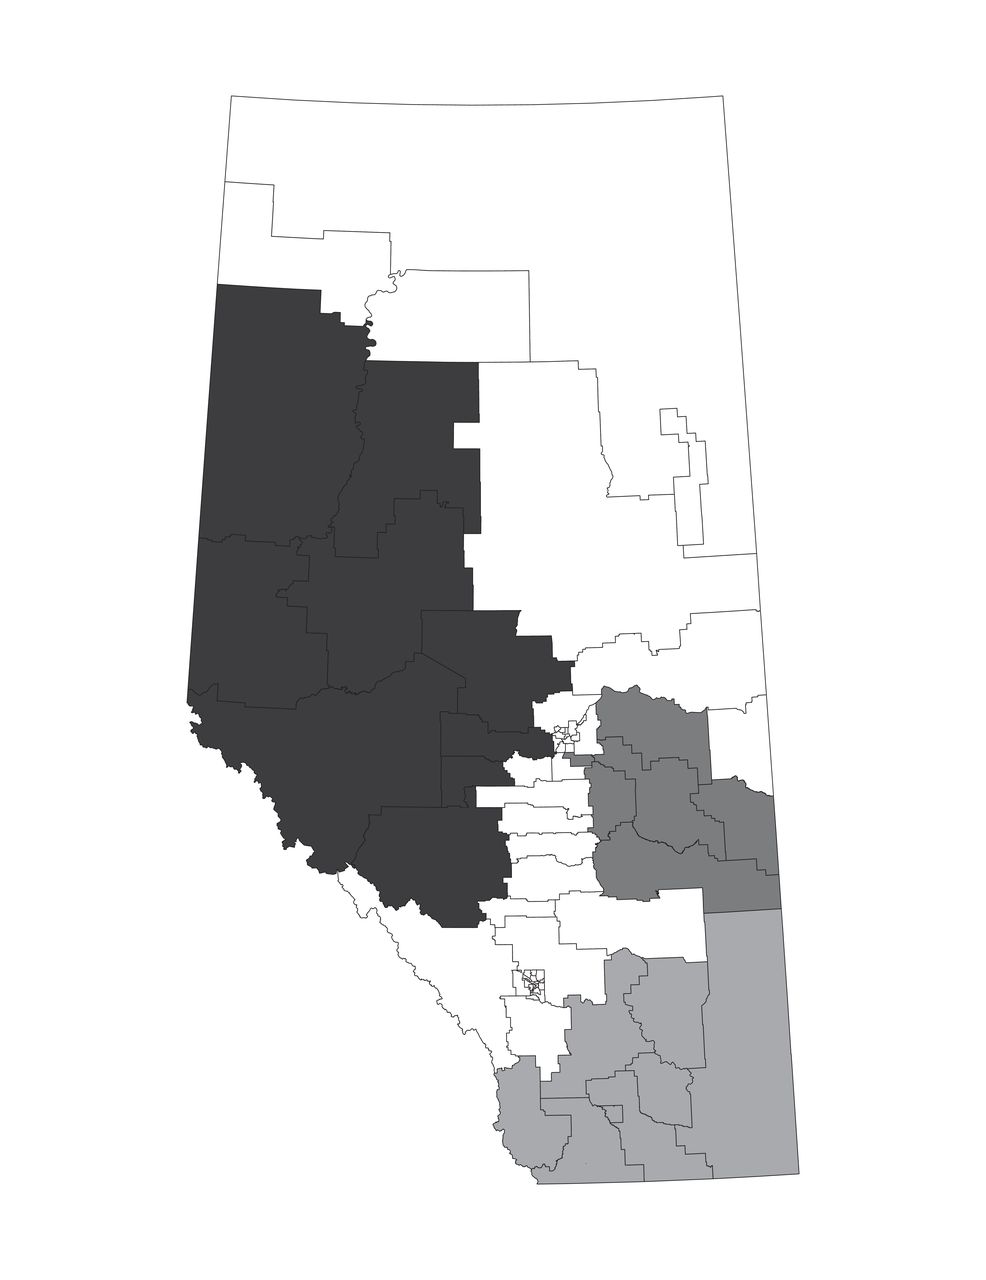
Clusters identified with statistically higher risks inside the cluster than outside the cluster for acute coronary syndromes. Cluster 1 = darkest grey, cluster 2 = dark grey, cluster 3 = medium grey.
When clusters 1, 2 and 3 were combined, variables differed for the patients residing inside versus outside the clusters (Table 3). The clusters were less likely to have nonsubsidized adults (OR 0.74, 95% CI 0.61-0.91) and more likely to have patients with a prior hospital admission (OR 1.44, 95% CI 1.24-1.68) or emergency department presentation for ACS (OR 1.29, 95% CI 1.04-1.59) in the previous 2 years. Patients living inside the clusters were less likely to have had a specialist claim (OR 0.64, 95% CI 0.56-0.73) and had fewer specialist claims (OR 0.97 per claim, 95% CI 0.96-0.98) and more general practitioner claims (OR 1.01 per claim, 95% CI 1.01-1.01) than patients living outside the clusters. Notably, 1082 (49.5%) of the 2186 patients in clusters 1-3 had a specialist visit in the prior 2 years, compared to 2405 (57.9%) of the 4156 patients outside the clusters (Appendix 1, Supplemental Table S1, available at www.cmajopen.ca/content/5/2/E402/suppl/DC1). Furthermore, 82 (8.9%) of the 926 patients in cluster 1 had at least 1 emergency department presentation that ended in admission, compared to 176/1260 (14.0%) for clusters 2 and 3 and 547/4156 (13.2%) for the rest of the province.
Heart failure
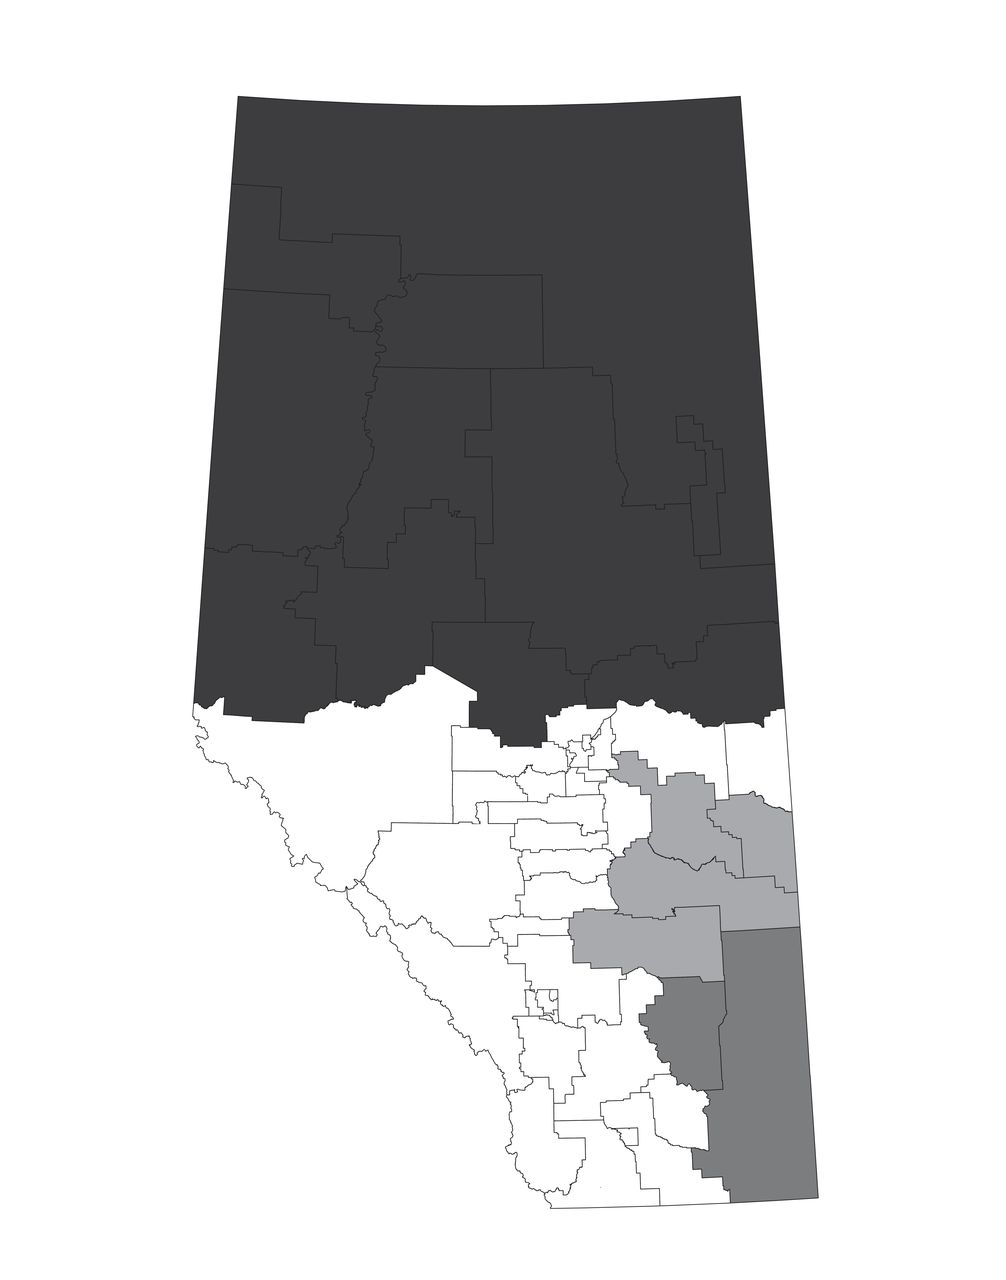
Cluster 1 for heart failure included several of the areas that were part of cluster 1 for ACS as well as the northeastern part of the province (Table 2, Figure 5). The ratio of observed (n = 677) to expected (n = 399.32) patients for cluster 1 was 1.70, and the relative risk was 1.81 (p < 0.001). Cluster 2 included 2 areas that were part of cluster 3 for ACS. The southeast portion of the province had a relative risk of 1.77 (p < 0.001), and cluster 3, in eastern Alberta, had a relative risk of 1.39 (p < 0.003).

Clusters identified with statistically higher risks inside the cluster than outside the cluster for heart failure. Cluster 1 = darkest grey, cluster 2 = dark grey, cluster 3 = medium grey.
After adjustment for other factors, the patients living in clusters 1, 2 and 3 were less likely to be female (OR 0.82, 95% CI 0.71-0.94) and more likely to have a history of ACS (OR 1.34, 95% CI 1.12-1.60) (Table 3) than patients living outside the clusters. They were more likely to have had a hospital admission in the prior 2 years (OR 1.44, 95% CI 1.21-1.71), more likely to have had a prior emergency department presentation for ACS (OR 1.49, 95% CI 1.15-1.92), more likely to have had a prior emergency department presentation for heart failure (OR 1.41, 95% CI 1.16-1.71) and less likely to have had a prior specialist visit (OR 0.51, 95% CI 0.43-0.61). These patients also had more general practitioner claims (OR 1.00 per claim, 95% CI 1.00-1.01) and fewer specialist claims (OR 0.98 per claim, 95% CI 0.97-0.98) than patients outside the clusters. A total of 726 (61.2%) of the 1187 patients in clusters 1-3 had had a specialist visit in the prior 2 years, compared to 2617 (72.8%) of the 3593 patients outside the clusters (Appendix 1, Supplemental Table S2).
Interpretation
We identified important geographic variations in ACS and heart failure in Alberta. Interestingly, different clusters were identified for ACS and for heart failure, with only some areas identified as part of the clusters for both conditions. Since the risk factors for the 2 conditions are similar, this finding argues against regional differences in underlying risk factor distributions. Similarly, specialist access would be the same for the 2 conditions in a geographic area.
Few investigators have examined geographic clustering for cardiac and cardiovascular conditions. In 2010/11, we identified clusters of patients presenting to the emergency department for atrial fibrillation and flutter in several areas as well as clusters of these patients with a subsequent physician claim for stroke or heart failure.2 In the previous study, we used a different statistical method for detecting clusters and found that most of the northern, some of the western and some of the southern areas were clusters, alone or in combination with neighbouring areas. van Rheenen and colleagues13 also used the spatial scan test and dissemination areas to identify regional variation in ischemic stroke, transient ischemic attack, intracerebral hemorrhage, subarachnoid hemorrhage and in-hospital mortality for Alberta patients with a diagnosis of stroke who accessed the health care system (e.g., hospital admissions, ambulatory care including emergency department visits) during 2002-2008. They found that clusters for different conditions did not overlap. Other cluster detection studies using Alberta data have focused on different conditions.16-20 Although geographic variation in admission rates or length of stay has been identified in multiple studies for ambulatory-care-sensitive conditions,21 many investigators did not conduct statistical cluster detection tests or consider emergency department visits. The clusters identified in our study may exist because of a greater severity of disease (which could be related to risk factors that vary geographically), differences in emergency department management, a lack of available health care services outside the emergency department or a combination of these factors.
This study also revealed important differences in the characteristics of patients residing inside and outside the clusters after adjustment for other variables. As expected, most of the characteristics related to use of health care services (prior hospital admission, emergency department presentation, physician claims) were higher for patients in the clusters, and these effects are likely indicative of sicker patients who saw their general practitioners more frequently and may have ended up presenting to the emergency department or being admitted to hospital as they became sicker. However, the finding that patients in the clusters were less likely to have had a prior specialist claim and had fewer specialist claims is surprising if the patients were truly sicker. This result suggests that access to specialists may be reduced in some areas and gives rise to the hypothesis that earlier specialist intervention may reduce future emergency department presentations. A natural experiment conducted in Alberta showed that increasing access to specialist care for patients with heart failure after hospital discharge was associated with statistically significant declines in rates of death and readmission in the first 30 days after discharge.22 In Quebec, the association between affiliation with a specialist and emergency department use depended on patient age: those under 65 years had lower emergency department use, whereas older patients had higher emergency department use, and patients without a primary physician had more emergency department use than patients with a specialist primary physician.23 Although that study involved a large number of patients, the authors did not examine specific conditions or specialties. Results from different health care systems may not be able to inform policy locally.24
Limitations
Study limitations include the possibility that the case definition may not be representative of all patients with ACS or heart failure. We did not complete a validation component to this study; however, the Alberta databases that we used have been found to be accurate for ACS and heart failure.25 The prior histories and comorbidities may not perfectly identify patients. For example, the recommendation for identifying patients with hypertension is "2 claims within 2 years or 1 hospitalization;"26 however, the data extract did not include admitting diagnosis. Proxies for socioeconomic status (e.g., Aboriginal status, subsidy level) may be neither sensitive nor specific. Aboriginal status includes only Treaty First Nations and Inuit peoples and underestimates Indigenous peoples, since Metis and non-Treaty First Nations Albertans are excluded. Finally, these databases do not provide treatment details, so clinician adherence to evidence-based management guidelines and patient adherence to such treatment as well as characteristics such as smoking history cannot be determined. Nonetheless, we do not feel that these limitations had a substantial effect on our findings.
Conclusion
This study showed geographic variations based on the number of people presenting to the emergency department for ACS or heart failure that was not entirely explained by differences in demographic characteristics or comorbidities. Patients living in the cluster areas did, however, exhibit lower rates of prior contact with specialist physicians. There are likely other potential differences that may help to explain the clustering (e.g., cultural, dietary and environmental considerations); however, we were unable to explore these factors in these analyses. We hypothesize that increasing specialist access may reduce the reliance on emergency department services in cluster areas, although this should be tested empirically. Innovative interventions to improve access to specialists (e.g., teleconsultation, remote monitoring, specialist visiting clinics in regional centres) need to be explored.
Supplemental information
For reviewer comments and the original submission of this manuscript, please see www.cmajopen.ca/content/5/2/E402/suppl/DC1
Acknowledgements
The authors thank Alberta Health for providing the data.
Footnotes
Competing interests: None declared.
Contributors: Rhonda Rosychuk and Brian Rowe acquired the data. Rhonda Rosychuk performed the statistical analysis and drafted the manuscript. All of the authors contributed substantially to study conception and design, interpreted the data, revised the manuscript critically for important intellectual content, approved the final version to be published and agreed to act as guarantors of the work.
Funding: This work was partially supported by grant AHW FP12-784 from Alberta Health. Rhonda Rosychuk was supported by a salary award from Alberta Innovates - Health Solutions (AIHS; formerly the Alberta Heritage Foundation for Medical Research) as a Health Scholar. Brian Rowe's research is supported by a Tier 1 Canada Research Chair in Evidence-based Emergency Medicine from the Canadian Institutes of Health Research. Finlay McAlister receives salary support from AIHS and the University of Alberta Chair in Cardiovascular Outcomes Research.
Disclaimer: This study is based in part on data provided by Alberta Health. The interpretation and conclusions contained herein are those of the authors and do not necessarily represent the views of the Government of Alberta. Neither the government nor Alberta Health expresses any opinion in relation to this study.
References
- Copyright 2017, Joule Inc. or its licensors
In this issue

Article tools


Related Articles
Cited By...
- No citing articles found.