


Abstract
Background: Air pollution is a known trigger for exacerbations among individuals with asthma, but its role in the development of new-onset asthma is unclear. We compared the rate of new asthma cases in Sarnia, a city with high pollution levels, with the rates in 2 neighbouring regions in southwestern Ontario, Canada.
Methods: Using a population-based birth cohort design and linked health administrative data, we compared the hazard of incident asthma among children 0 to 10 years of age between those born in Lambton (Sarnia) and those born in Windsor and London–Middlesex, for the period Apr. 1, 1993, to Mar. 31, 2009. We used Cox proportional hazards models to adjust for year of birth and exposure to air pollutants (nitrogen dioxide, sulphur dioxide [SO2], ozone and small particulate matter [PM2.5]), as well as maternal, geographic and socioeconomic factors.
Results: Among 114 427 children, the highest incidence of asthma was in Lambton, followed by Windsor and London–Middlesex (30.3, 24.4 and 19.8 per 1000 person-years, respectively; p < 0.001). Relative to Lambton, the hazard of asthma, adjusted for socioeconomic and perinatal factors, was lower in Windsor (hazard ratio [HR] 0.72, 95% confidence interval [CI] 0.67–0.77) and London–Middlesex (HR 0.65, 95% CI 0.61–0.69). Inclusion of air pollutants attenuated this relative difference in both Windsor (HR 0.79, 95% CI 0.62–1.01) and London–Middlesex (HR 0.89, 95% CI 0.64–1.24).
Interpretation We identified a higher incidence of asthma among children born in Lambton (Sarnia) relative to 2 other regions in southwestern Ontario. Higher levels of air pollution (particularly SO2 and PM2.5) in this region, as experienced by children in their first year of life, may be contributory.
Asthma is the most common chronic disease in children, with a Canadian prevalence of 15% to 25%.1 Asthma exacerbations reduce quality of life and are a leading cause of emergency department visits and hospital admissions.2 Whereas numerous risk factors for asthma exacerbations are known,3–12 identifying new, modifiable risk factors for onset of this condition could lead to primary prevention.
There is a clear association between asthma exacerbations and air pollution in those with previously diagnosed asthma13–17 but less certainty as to whether air pollution might contribute to new-onset asthma.18–21 This association has been challenging to study because of inadequate attribution of air pollution exposure, owing to population mobility and difficulties in differentiating between workplace and residential exposures. Furthermore, most research has focused on adults,22,23 whereas asthma likely develops during gestation or within the first year of life.24,25 As such, it is necessary to elucidate the influence of exposure to pollution on development of asthma in children. A recent systematic review of the relation between incident asthma in children and exposure to air pollution was inconclusive.26
In the province of Ontario, Canada, a spatial analysis of asthma prevalence between 2002 and 2006 identified a cluster of high rates among children 10 to 14 years of age in and around the city of Sarnia.27 Sarnia, in southwestern Ontario, is home to the “Chemical Valley,” which accounts for 40% of Canada’s chemical processing facilities. These facilities produce a wide range of products, such as plastics, industrial materials and a variety of consumer goods.28,29 This region has been recorded as having the worst air quality in the country,30 with measurements above the limits recommended by the World Health Organization.31 In recent years, this region has received media and government attention because of revelations of unreported toxic emissions and high levels of morbidity as a result of exposure to pollutants.18,32,33
We aimed to clarify the link between exposure to air pollution and incident asthma in a subset of Canadian children. Using a population-based birth cohort design, we compared the rate of new asthma cases in Sarnia with rates in 2 neighbouring regions in southwestern Ontario, with adjustment for various factors, including year of birth; maternal, geographic and socioeconomic factors; and exposure to air pollutants. We also examined whether the hazard of incident asthma was attenuated by the reduction in air pollution levels in more recent years.
Methods
Design and setting
We conducted a longitudinal birth cohort study spanning 25 years (Apr. 1, 1993, to Mar. 31, 2018) using linked health administrative databases available at ICES. We chose this period because it had good data availability and because it overlaps with an observed change in asthma trends in Ontario.34 We compared the incidence of asthma among children born between Apr. 1, 1993, and Mar. 31, 2009, in 3 neighbouring urban regions in southwestern Ontario. The reporting of this study follows the Reporting of Studies Conducted Using Observational Routinely Collected Health Data (RECORD) guidelines for observational studies.35,36
Data sources
In the province of Ontario (population 14 million), more than 99% of residents are eligible for government-funded health insurance through the Ontario Health Insurance Plan (OHIP). We used encoded identifiers based on the OHIP number to link individuals to multiple health administrative data sets, including the OHIP data set, which contains information on all physician outpatient visits; the Ontario Registered Persons Database, which provides basic demographic information; and the Canadian Institute for Health Information Discharge Abstract Database (CIHI-DAD), which details all hospital admissions. The MOMBABY data set is derived from the CIHI-DAD and includes records for all mothers linked to their Ontario-born children. The Ontario Marginalization Index37,38 is a geographically based marker of socioeconomic status, consisting of 4 dimensions: residential instability, material deprivation, dependency and ethnic concentration. We linked these data sets using the unique encoded identifiers and analyzed them at ICES (Appendix 1, Table S1, available at www.cmajopen.ca/content/9/2/433/suppl/DC1).
For data on air quality, we used Ontario Ministry of Environment air quality data39 and Environment Canada’s National Air Pollution Surveillance data.40 These publicly available data sets provide information about air pollution across the province.
Participants
We included all live in-hospital births that occurred within the Lambton (where Sarnia is the major urban centre), Windsor and London–Middlesex Local Health Integration Network (LHIN) subregions over a 15-year accrual period (between Apr. 1, 1993, and Mar. 31, 2009). Since 2006, LHINs have been the health authorities responsible for regional administration of health care services in Ontario.41
We selected these 3 subregions for comparison because they align with previously conducted studies;42,43 because they are geographically proximate, with each of their major cities (Sarnia, Windsor and London, respectively) separated by no more than 200 km; and because they have similar climate, outdoor allergens, ethnic diversity, and lifestyle and socioeconomic exposures. These centres also have integration of many pediatric health services and are served by a single pediatric tertiary care hospital. The subregions differ in terms of their air pollution levels because of the major industries present in each (Appendix 1, Supplementary Methods).
We excluded births that occurred outside these subregions and those for which the mother lived in a different subregion in the 1-year period before delivery (to establish perinatal exposure). We excluded deliveries of multiple births and births before 37 weeks gestation, because these situations are known risk factors for asthma.44 We further excluded deliveries in which the mother was younger than 14 years or older than 50 years and those involving infants who died or did not reside in the region of birth for at least 1 year (to establish early-life exposure).
Exposures
Our primary exposure of interest was the geographic area of birth, namely, the LHIN subregions of Lambton, Windsor and London–Middlesex. We determined the area of birth from the child’s postal code at birth (Appendix 1, Table S2).
We also considered the following secondary exposures: the fiscal year in which the child was born, to corroborate air pollution levels in utero and during the first year of life (the critical period of susceptibility), and the ambient concentration of various air pollutants, as a proxy for exposure to air pollution. The most common air pollutants, found as gases or particles in the atmosphere we breathe, are produced from industrial processes or as the by-products of biomass or fuel combustion (e.g., motor vehicle exhaust in traffic-related air pollution). We considered the following pollutants: nitrogen dioxide (NO2), ground-level ozone (O3), sulphur dioxide (SO2) and particulate matter 2.5 μm or smaller (PM2.5). The 2020 Canadian ambient air quality standards (www.ccme.ca/en/air-quality-report#slide-7) recommend the following levels for these pollutants: NO2 less than 17.0 parts per billion (ppb)/year, O3 less than 62 ppb/8 hours, SO2 less than 5.0 ppb/year and PM2.5 less than 8.8 μg/m3/year.
We assigned exposure to each air pollutant for each child on the basis of forward sortation area or city region of birth and fiscal year of birth. We also included additional covariables reported to be associated with risk of childhood asthma (Appendix 1, Supplementary Methods).
Outcomes
Our primary outcome was the incidence of physician-diagnosed asthma, as identified using the Ontario Asthma Surveillance Information System. This system has sensitivity of 89% and specificity of 72% for detecting asthma in children, based on an algorithm that includes 1 hospital admission or 2 physician outpatient visits for asthma within 2 years.45 It has been widely used to evaluate asthma rates and related health care burden in Ontario.1,4,45–48
We followed each child for a maximum of 10 years, which a previous study indicated would allow capture of up to 85% of childhood asthma cases.49 Our secondary outcome was persistent asthma beyond age 6 years (Appendix 1, Supplementary Methods).
Statistical analysis
We compared baseline cohort characteristics between regions using 1-way analysis of variance and χ2 tests as appropriate. We constructed Kaplan–Meier curves to examine the 10-year incidence of asthma and compared regions using the log-rank test. We censored individuals at the age of 10 years or at death.
We used adjusted Cox proportional hazards models to assess the relative difference in hazard of asthma by age 10 in the 3 subregions, with Lambton as the reference category. We adjusted the models for maternal age, maternal asthma, sex, rural geography, neighbourhood material deprivation, neighbourhood ethnic concentration, cesarean delivery and fiscal year of birth. Because of recent declines in pollution levels, we tested for an interaction between subregion and year of birth using the likelihood ratio test and, if the result was significant, reported results in 4-year groupings (fiscal years 1993–1996, 1997–2000, 2001–2004 and 2005–2008). We also checked for differences in the hazard of asthma stratified by age 0 to less than 2 years, 2 to less than 6 years, and 6 years or older, corresponding to early and late preschool and older childhood age groups, respectively. For our secondary outcome, we developed a second adjusted Cox proportional hazards model to examine the hazard of persistent asthma beyond age 6 years.
To compare the hazard of incident asthma attributable to NO2, O3, SO2 or PM2.5, we developed 4 predefined sensitivity models as described above, but each with the additional inclusion of exposure to 1 pollutant. We restricted these analyses to include only patients with complete information for all pollutant exposures. We developed models with and without cubic splines to account for any nonlinear relations between pollutant exposures and asthma incidence. In a final analysis, we included all pollutants in the same model.
We express the results as hazard ratios (HRs) and 95% confidence intervals (CIs). We conducted all analyses with SAS software, version 9.4 (SAS Institute), and we interpreted 2-tailed p values less than 0.05 as statistically significant.
Ethics approval
This study was approved by the Children’s Hospital of Eastern Ontario research ethics board (CHEO REB No. 21/03PE).
Results
We identified 2 112 270 children who were born in an Ontario hospital between the fiscal years of 1993 and 2008. After exclusions for data integrity and birth outside the regions of interest, we retained a total of 114 427 children for the analysis (Figure 1): 16 758 (14.6%) born in Lambton, 34 962 (30.6%) born in Windsor and 62 707 (54.8%) born in London–Middlesex.
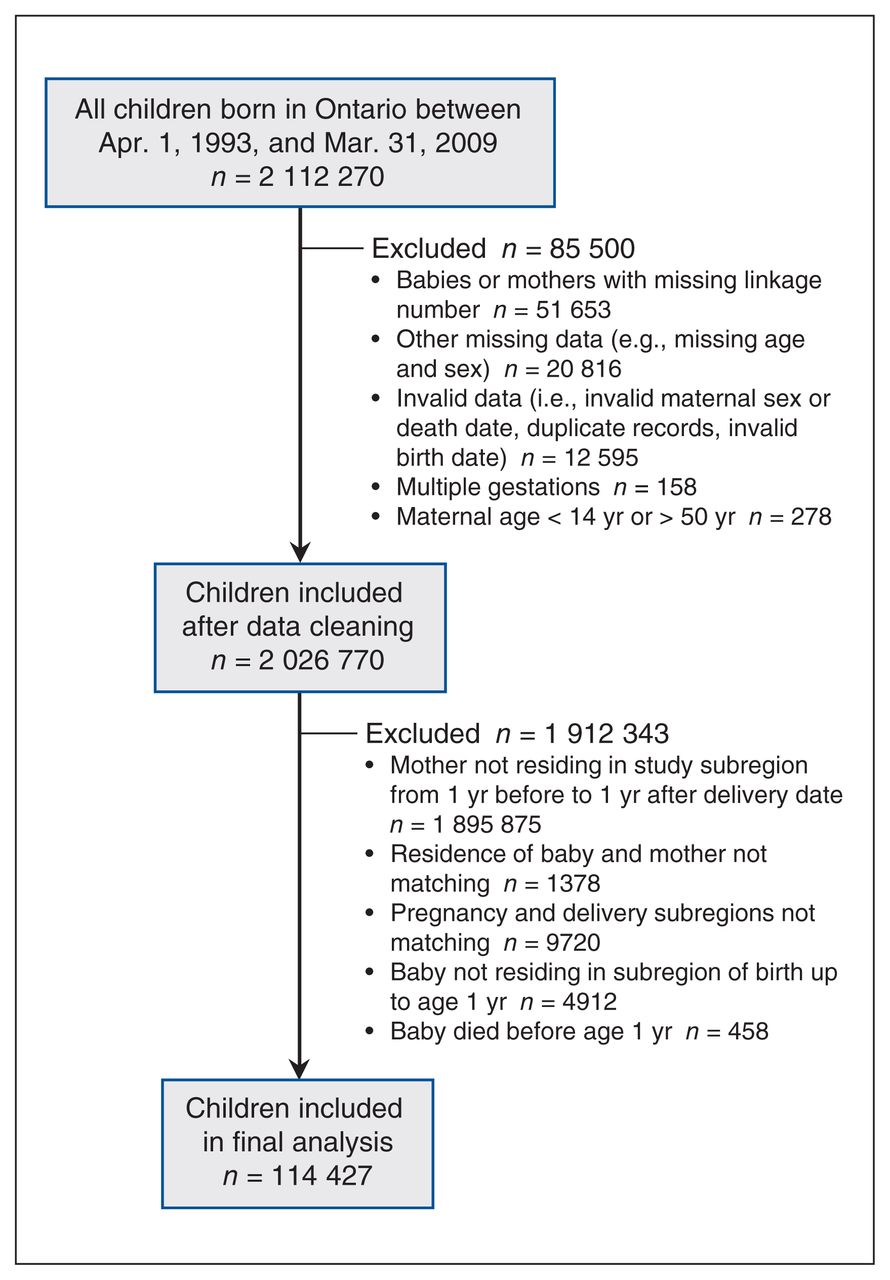
Flow chart for cohort.
The most notable differences in baseline population characteristics (Table 1) were rurality, which was highest in Lambton (27.2% of the population), and neighbourhood-level characteristics, such as income quintile distribution, with evidence of lower socioeconomic status in Windsor, along with higher levels of ethnic concentration and material deprivation.
Characteristics of the study cohorts
Average air pollutant levels at birth differed between regions, with the highest concentration of NO2 in Windsor (34.9 [standard deviation, SD 3.9] ppb) and the highest concentrations of O3 (41.8 [SD 1.9] ppb), PM2.5 (23.6 [SD 2.8] ppb) and SO2 (8.8 [SD 1.8] ppb) in Lambton. Air pollutant levels generally decreased over the study period, although levels of O3 remained stable (Appendix 1, Figure S1, Panels A–D).
Asthma incidence
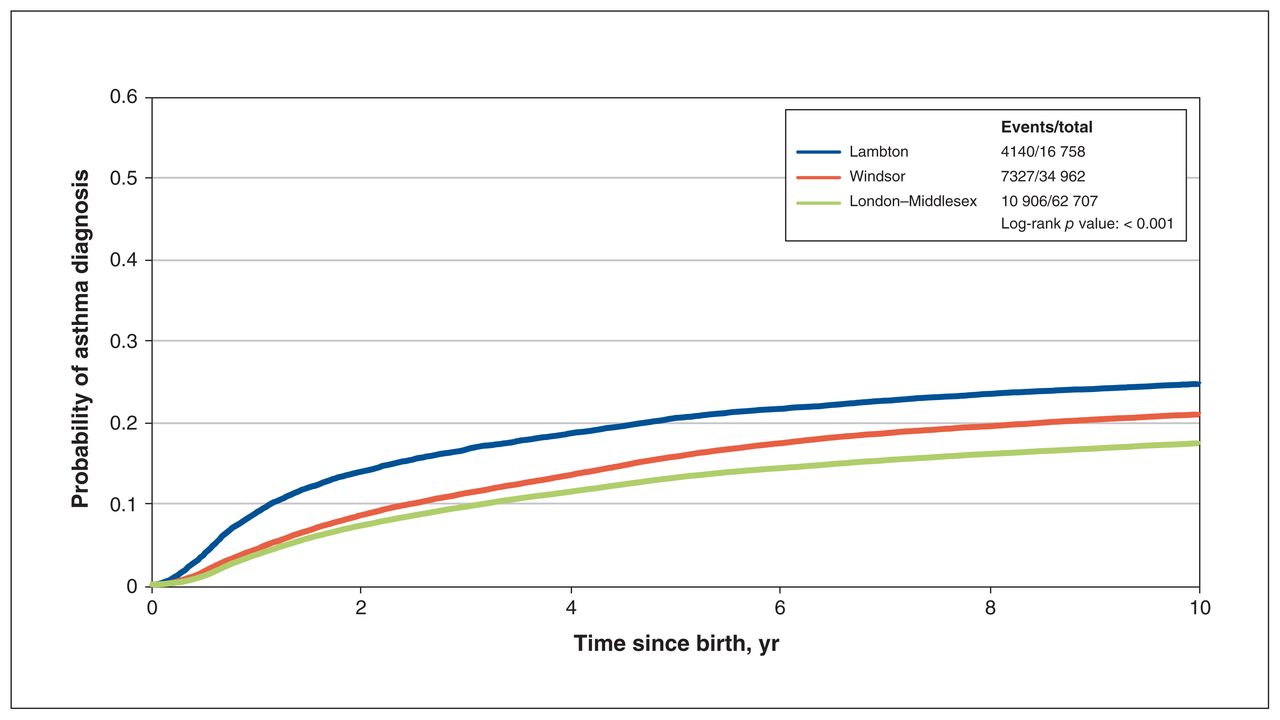
The overall cumulative incidence of asthma by age 10 years was 22.6 per 1000 person-years, with the highest incidence in Lambton, intermediate incidence in Windsor and the lowest incidence in London–Middlesex (30.3, 24.4 and 19.8 per 1000 person-years, respectively; p < 0.001) (Figure 2).

Probability of developing asthma by region of birth, censored at age 10 years.
We found a significant interaction by birth year (p < 0.001). When we stratified models by fiscal year eras, the unadjusted and adjusted HRs remained significant across the years, with estimates attenuating over time (Table 2). The lowest hazard of asthma persisted in London–Middlesex (for birth years 2005–2008, adjusted HR 0.65, 95% CI 0.60–0.71), followed by Windsor (for birth years 2005–2008, adjusted HR 0.67, 95% CI 0.61–0.74), relative to Lambton. When we stratified the models by age categories, we found that the excess hazard of asthma in Lambton was most pronounced at younger ages, between 0 and 2 years (Appendix 1, Table S3).
Cox proportional hazards estimates for the development of asthma by age 10 years, stratified by era
In our secondary analysis, we found that the adjusted hazard of persistent asthma beyond age 6 was still lowest in London–Middlesex (HR 0.62, 95% CI 0.59–0.65), followed by Windsor (HR 0.76, 95% CI 0.72–0.80), relative to Lambton (Appendix 1, Table S4).
Sensitivity analyses
In sensitivity analyses with a restricted sample size (n = 44 737, for births between fiscal years 2003 and 2008), including only those children with complete information for all pollutant exposures, the hierarchy of the adjusted hazard of asthma between subregions was preserved, although the magnitude of the difference was reduced with the sequential addition of individual air pollutants, the greatest reduction being noted after the addition of SO2. When all 4 air pollutants were combined, the difference in adjusted hazard of asthma was further reduced and no longer significantly different between regions (Table 3). Using cubic splines to represent a potential nonlinear association between air pollutants and hazard of asthma did not further change these results (Appendix 1, Table S5, Figure S2).
Association of individual air pollution exposures with adjusted Cox proportional hazards estimates for development of asthma by age 10 years
Interpretation
In this population-based study comparing 3 cities in southwestern Ontario that had varied levels of air pollution over 25 years, we observed a significantly lower cumulative incidence of asthma in London–Middlesex and Windsor compared with Lambton (Sarnia). This difference was present after adjustment for multiple confounders associated with asthma risk, such as sex, socioeconomic factors and urban versus rural setting. Although the hazard of incident asthma declined in more recent years, the hierarchy of adjusted asthma risk between subregions was preserved and remained significant. These findings were most apparent in children 0 to 2 years of age, but also remained robust when we examined for persistent asthma beyond the age of 6 years. The difference in asthma risk estimates was reduced with further adjustment for exposure to SO2 and PM2.5 and was no longer significant in a subset of children when all 4 air pollutants were included in the model.
Our results suggest that children in Sarnia have an increased risk of developing asthma, which might be due to higher levels of air pollutants in this region. For our sample of more than 100 000 children born in southwestern Ontario over a 16-year period, higher levels of PM2.5 and SO2 were present in the first year of life for children born and living in the Lambton LHIN subregion (which includes Sarnia). We also found that the decline in the risk of asthma in more recent years paralleled the concurrent decrease in air pollution observed following the closure of certain chemical and polymer industries and coal plants.50
Our results are similar to those of the few other studies that have explored and identified a relation between incidence of asthma and exposure to air pollution in children.15,16 However, because of its natural experimental design, our study strengthens these previous observations by showing an increased risk of asthma relative to regions with lower air pollution levels. A recent study of children in California showed reductions in asthma incidence concurrent with a reduction in air pollution,51 suggesting a possible dose–response effect. That previous study relied on reporting by the patient or parent of an asthma diagnosis (which may be unreliable), whereas we used physician diagnosis of asthma as the outcome (a more valid approach) and similarly showed reductions in asthma incidence with decline in ambient air pollution levels in recent years.
Reduced air pollution may not be the only reason for recent decreases in the incidence of asthma. Lower rates of public smoking and increases in protective factors such as breastfeeding may have also contributed. In our analyses that adjusted for all 4 air pollutant exposures in combination, the hazard ratios did not approximate 1, which suggests there may have been residual confounding not fully addressed by our methods to attribute air pollutant exposures or other unmeasured environmental exposures. However, in this adjusted analysis, the difference in the hazard of asthma between regions, particularly for the comparison between London–Middlesex and Lambton, was no longer statistically different, lending further support to the likelihood of air pollution being an important mechanism in the development of childhood asthma.
Recent literature has focused on the effect of traffic-related air pollution on asthma development,52–55 because the measured effects of industry-related pollutants have been inconsistent in previous studies, perhaps due to inaccuracies in assignment of pollution exposure.56–58 In our study, we were able to analyze the difference in asthma risk between regions attributable to each type of air pollutant sequentially and found that adjustment for exposure to NO2 and O3 (compounds that are present in the atmosphere primarily because of traffic-related air pollution) did not really change the hazard of incident asthma. Adjustment for SO2 and PM2.5 significantly attenuated the difference in asthma risk between London–Middlesex or Windsor and Lambton, suggesting that these may be the most contributory air pollutants to explain differences in asthma risk in this region. Although PM2.5 and SO2 are present in traffic-related air pollution, the largest sources in Sarnia are from major industrial processes, including petrochemical processing and smelting.
A few recent studies have linked PM2.5 to new-onset asthma both in the United States and globally.51,59–61 In Canada, Buteau and colleagues19 examined the incidence of asthma in relation to proximity to industrial air pollution emitters in a population-based birth cohort and found that the hazard of asthma incidence was proportional to increasing exposure to PM2.5 and SO2. In their cohort study, Clark and colleagues18 similarly showed that the incidence of asthma in preschool children was proportional to the distance from industrial emitters, within a 10-km radius of the child’s residence at birth and during the first year of life. Our current study supports these previous studies, although the latter had limited duration of follow-up and lack of adjustment for traffic-related air pollutants. The mechanisms for how air pollution might increase a child’s susceptibility to development of asthma are unclear, but they may be secondary to epigenetic pathways or damage to airway epithelium due to oxidative stress, which may result in airway remodelling, inflammatory and immunologic responses, and enhanced respiratory sensitization to aeroallergens.62,63
Limitations
This study had several strengths, including a population-based design, a long observation period and a large sample size, all of which contribute to the generalizability of the findings. One of the potential limitations is that the study design did not allow for individual measures of air pollution exposure, which could vary according to differences in time spent outdoors or type of dwelling and indoor ventilation. Some of this potential misclassification would have been addressed by our natural study design, which allowed comparison of asthma incidence in a subregion that had very high ambient pollution with otherwise comparable geographic regions having substantially lower overall pollution levels, such that small variations in individuals’ exposure within a given subregion might not have been important.
Our assignment of air pollution exposure at birth and in the first year of life did not account for potential movement of children between the 3 study subregions later in life, which could have diluted the observed relation between air pollution and asthma incidence. Similarly, we did not account for changes in marginalization characteristics over the life of the child. However, the premise of this study was to explore the impact of exposures early in life (in utero and up to 1 year of age) on asthma incidence, given growing evidence that this critical window is most deterministic in an individual’s lifetime asthma risk.25,64
Findings in the literature support the proposition that early-life exposures influence development of the lungs,65 as well as the gut microbiome and immune system,66,67 such that exposures later in life (e.g., caused by moving to regions with different pollutant levels or different marginalization characteristics) may be less important in conferring asthma risk.
We used health administrative data, so there was the potential for misclassification of our asthma outcome, despite our use of a validated algorithm. We did not use propensity scores to adjust for lifestyle factors, which may have differed between regions, and we were limited in our ability to account for some of these potential unmeasured contributors to asthma risk, (e.g., environmental tobacco smoke, maternal breastfeeding or exposure to allergens). In addition, many of the covariables used in our analysis could at best be attributed at the neighbourhood level, rather than the individual level.
Conclusion
We found a higher incidence of asthma among children born in the Lambton (Sarnia) LHIN subregion, relative to 2 other subregions in southwestern Ontario. We observed that SO2 and PM2.5, industrial pollutants found at highest levels in the Lambton subregion, may have contributed to this higher asthma risk. These results suggest that limiting early exposure to air pollution may be a strategy for primary prevention of asthma and could be confirmed in future studies.
Footnotes
Competing interests: None declared.
This article has been peer reviewed.
Contributors: All of the authors participated in study design. Alexandra Ouédraogo and Salimah Shariff performed the data analysis, and all of the authors participated in interpreting the results. Dhenuka Radhakrishnan wrote the first draft of the manuscript, and all of the authors revised the manuscript for important intellectual content. All of the authors approved the final version to be published and agreed to be accountable for the work.
Funding: This study was supported by ICES, which is funded by an annual grant from the Ontario Ministry of Health and the Ontario Ministry of Long-Term Care. The study was completed at the ICES Western site, where core funding is provided by the Academic Medical Organization of Southwestern Ontario, the Schulich School of Medicine and Dentistry, Western University and the Lawson Health Research Institute (LHRI). This study also received funding from an LHRI Internal Research Fund grant.
Disclaimer: This study was supported by ICES, which is funded by an annual grant from the Ontario Ministry of Health and the Ontario Ministry of Long-Term Care. Parts of this material are based on data and information compiled and provided by the Canadian Institute for Health Information, the Ontario Ministry of Health and Long-Term Care (now 2 separate ministries) and the Ontario Ministry of the Environment. The results, analyses, conclusions, opinions and statements expressed herein are solely those of the authors and are independent from the funding and data sources. No endorsement by ICES, the Ontario Ministry of Health, the Ontario Ministry of Long-Term Care or the Ontario Ministry of the Environment is intended or should be inferred.
Data sharing: The data set from this study are held securely in coded form at ICES. Although legal data-sharing agreements between ICES and data providers (e.g., health care organizations and government) prohibit ICES from making the data set publicly available, access may be granted to those who meet prespecified criteria for confidential access, available at https://www.ices.on.ca/DAS (email: das{at}ices.on.ca). The full data set creation plan and underlying analytic code are available from the authors upon request, with the understanding that the computer programs may rely upon coding templates or macros that are unique to ICES and are therefore either inaccessible or may require modification.
Supplemental information: For reviewer comments and the original submission of this manuscript, please see www.cmajopen.ca/content/9/2/E433/suppl/DC1.
This is an Open Access article distributed in accordance with the terms of the Creative Commons Attribution (CC BY-NC-ND 4.0) licence, which permits use, distribution and reproduction in any medium, provided that the original publication is properly cited, the use is noncommercial (i.e., research or educational use), and no modifications or adaptations are made. See: https://creativecommons.org/licenses/by-nc-nd/4.0/
References
- © 2021 CMA Joule Inc. or its licensors
In this issue

Article tools


