


Abstract
Background The first year after cancer diagnosis is a period of intensive treatment and high cost. We sought to estimate costs for the 21 most common cancers in Ontario in the 3-month period before and the first year after diagnosis.
Methods We used the Ontario Cancer Registry to select patients who received diagnoses between 1997 and 2007 at 19 years of age or older, with valid International Classification of Diseases for Oncology (ICD-O) and histology codes, who survived 30 days or longer after diagnosis and had no second cancer within 90 days of the initial cancer (n = 402 399). We used linked administrative data to calculate mean costs for each cancer during the pre- and postdiagnosis periods for patients who died within 1 year after diagnosis and patients who survived beyond 1 year after diagnosis.
Results Mean prediagnosis costs were $2060 (95% confidence interval [CI] $2023–$2098) for all patients with cancer. Costs ranged from $890 (95% CI $795–$985) for melanoma to $4128 (95% CI $3591–$4664) for liver cancer among patients who survived beyond 1 year after diagnosis, and ranged from $2188 (95% CI $2040–$2336) for esophageal cancer to $5142 (95% CI $4664–$5620) for multiple myeloma among patients who died within 1 year. The mean postdiagnosis cost for our cohort was $25 914 (95% CI $25 782–$26 046). Mean costs were lowest for melanoma ($8611 [95% CI $8221–$9001]) and highest for esophageal cancer ($50 620 [95% CI $47 677–$53 562] among patients who survived beyond 1 year after diagnosis, and ranged from $27 560 (95% CI $25 747–$29 373) for liver cancer to $81 655 (95% CI $58 361–$104 949) for testicular cancer among patients who died within 1 year.
Interpretation Our research provides cancer-related cost estimates for the pre- and postdiagnosis phases and offers insight into the economic burden incurred by the Ontario health care system. These estimates can help inform policy-makers’ decisions regarding resource allocation for cancer prevention and control, and can serve as important input for economic evaluations.
Cancer is the leading cause of premature death and the fourth leading cause of hospital admission in Canada.1 The most recent estimate of the total cost of cancer care in Canada is $14.2 billion in 1998.2 Cancer is the third most costly disease category, after cardiovascular and musculoskeletal diseases.2
The first year after cancer diagnosis is a period of particularly high costs and intensive treatment.3,4 One study in the United States found that first-year costs were highest for brain, pancreatic, esophageal and gastric cancers, and lowest for melanoma of the skin.3 To our knowledge, no comprehensive studies of pre- and postdiagnosis costs in Canada have been published. Few studies in any country have examined the costs of cancer treatment for patients under the age of 65 years.5,6
Our objective was to estimate the pre- and postdiagnosis costs for patients who received diagnoses for the 21 most common cancers in Ontario between 1997 and 2007, and to understand the pattern of resource use. We used a large population-based sample of adult patients and rich administrative health care data. Our cost estimates will be of use for future economic evaluations, and for planning future health care budgets and setting priorities for resource allocation in cancer prevention and control.
Methods
Study setting
We conducted a descriptive costing study evaluating all direct medical costs for patients whose first diagnosis for a primary cancer occurred between Jan. 1, 1997, and Dec. 31, 2007, and who survived longer than 30 days after diagnosis. We looked at the costs to the payer, the Ontario Ministry of Health and Long-Term Care. All costs were adjusted to 2009 Canadian dollars.7 The study was approved by the University of Toronto Research Ethics Board.
Patients
Patients were identified from the Ontario Cancer Registry, the population-based cancer registry for Canada’s largest province.8 We included patients who were 19 years of age or older at the time of diagnosis; were assigned a single, valid International Classification of Diseases for Oncology (ICD-O) topography code corresponding to a primary cancer; and had no second cancer diagnosed within 90 days after the initial diagnosis. We excluded all patients who had a cancer diagnosis recorded in the Ontario Health Insurance Plan (OHIP) database 180 days or more before the diagnosis date retrieved from the Ontario Cancer Registry.
We classified patients into 1 of the 21 most common cancer sites: brain, female breast, cervix, colorectal, corpus uteri, esophagus, gastric, head and neck, leukemia, liver, lung, lymphoma, melanoma, multiple myeloma, ovary, pancreas, prostate, renal, testis, thyroid and urinary bladder. A 22nd category consisted of all other tumour sites combined (Appendix 1 at www.cmajopen.ca/content/1/1/E1/suppl/DC1). Because unusual and/or incorrect histology codes had been recorded for some patients, we selected the 20 most frequent histology codes for each cancer type. These were reviewed by 2 practising oncologists to ensure that our cohort was representative of current clinical practice.
Data sources
Individual patient data from the Ontario Cancer Registry were linked to administrative health care data using OHIP numbers and anonymized. Data were accessed through the Institute for Clinical Evaluative Sciences or Cancer Care Ontario from the following databases (Table 1): New Drug Funding Program, Activity Level Reporting System, OHIP Claims History Database, Ontario Drug Benefit Program, Discharge Abstract Database, National Ambulatory Care Reporting System, Continuing Care Reporting System, Ontario Home Care Administrative System and Home Care Database.
Cost estimates obtained from the Discharge Abstract Database and the National Ambulatory Care Reporting System were calculated using the resource intensity weight method.9–11 These weights are numerical index values calculated annually by the Canadian Institute for Health Information and represent the relative cost of treatment according to different patient demographics. Cost estimates for other resources were either available in the data or obtained from other sources.12,13 See Appendix 2 at www.cmajopen.ca/content/1/1/E1/suppl/DC1 for a detailed explanation of the costing methodology.
Study design and analysis
We used a phase-based approach3,14,15 to examine the costs of care incurred before and after diagnosis. We divided each patient’s observation time into 2 periods based on the earliest positive diagnosis for a primary cancer in the Ontario Cancer Registry.8 The prediagnosis phase was defined as the 3 months before diagnosis and is typically characterized by diagnostic testing to establish the cancer diagnosis.16,17 The second phase, the initial phase of care, included the date of diagnosis and the subsequent 12 months. In this phase, patients received primary treatment, and adjuvant or neoadjuvant therapy, if required.
Information on stage of disease at diagnosis was not available for our cohort. One study in the US found that net costs of care were generally higher for patients diagnosed with distant disease (i.e., metastases) than for patients diagnosed with localized disease.3 Furthermore, patients who received diagnosis at an advanced stage of disease generally lived for a short period after diagnosis.3 As a proxy for stage of disease, we stratified patients according to survival into groups of patients who died within 1 year after diagnosis and patients who survived beyond 1 year.
We also calculated mean costs of care for the 4 major cancers (prostate, female breast, lung and colorectal) by local health integration network (LHIN). Local health integration networks are health authority regions (14 in total) created by the Ontario government in 2007 to plan, integrate and fund all public health care services at a local level.
Finally, we applied our overall (unstratified) postdiagnosis cost estimates to the number of patients who received a diagnosis of cancer in 2009 in Ontario to provide an estimate of the total economic burden incurred by the Ontario health care system during the first year after diagnosis.
Results
The final cohort of 402 399 patients had a mean age of 64 years at diagnosis. About 17.6% (70 809) died within 1 year and 82.4% (331 590) survived beyond 1 year after diagnosis. Table 2 provides their characteristics. The most common sites were prostate, female breast, colorectal and lung.
The mean overall prediagnosis cost for our cohort was $2060 (95% confidence interval [CI] $2023–$2098). Prediagnosis costs for patients who survived beyond 1 year ranged from $890 (95% CI $795–$985) for melanoma to $4128 (95% CI $3591–$4664) for liver cancer (Figure 1A; Appendix 3 at www.cmajopen.ca/content/1/1/E1/suppl/DC1, Table A). Among patients who died within 1 year, costs ranged from $2188 (95% CI $2040–$2336) for esophageal cancer to $5142 (95% CI $4664–$5620) for multiple myeloma (Figure 1B; Appendix 3, Table B). Among both groups of patients, prediagnosis costs accounted for about 30% of total costs (Appendix 3, Tables A and B). About 20% of prediagnosis costs were attributed to diagnostic testing and 20% to hospital admissions.
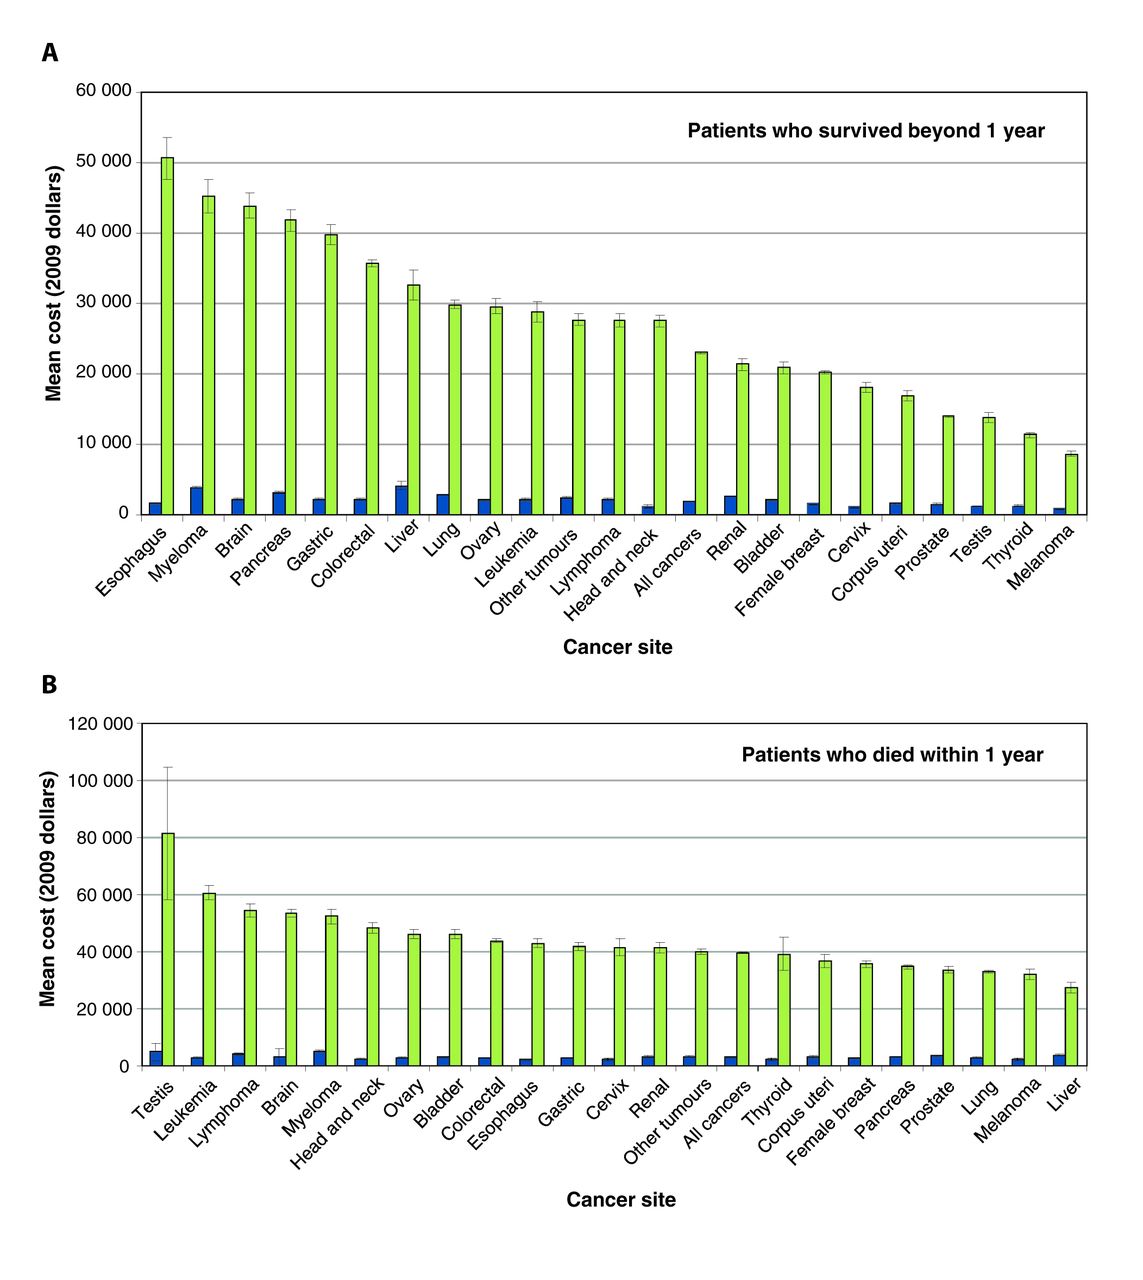
Mean direct cost of cancer care for the 3 months before and the first year after diagnosis by cancer site in (A) patients who survived beyond 1 year and (B) patients who died within 1 year. Note: The prediagnosis phase of care is the last 3 months before diagnosis (in blue). The initial phase of care is the first 12 months following diagnosis (in green). Error bars are 95% confidence intervals. All estimates are in 2009 Canadian dollars. See Appendix 3 for more details.
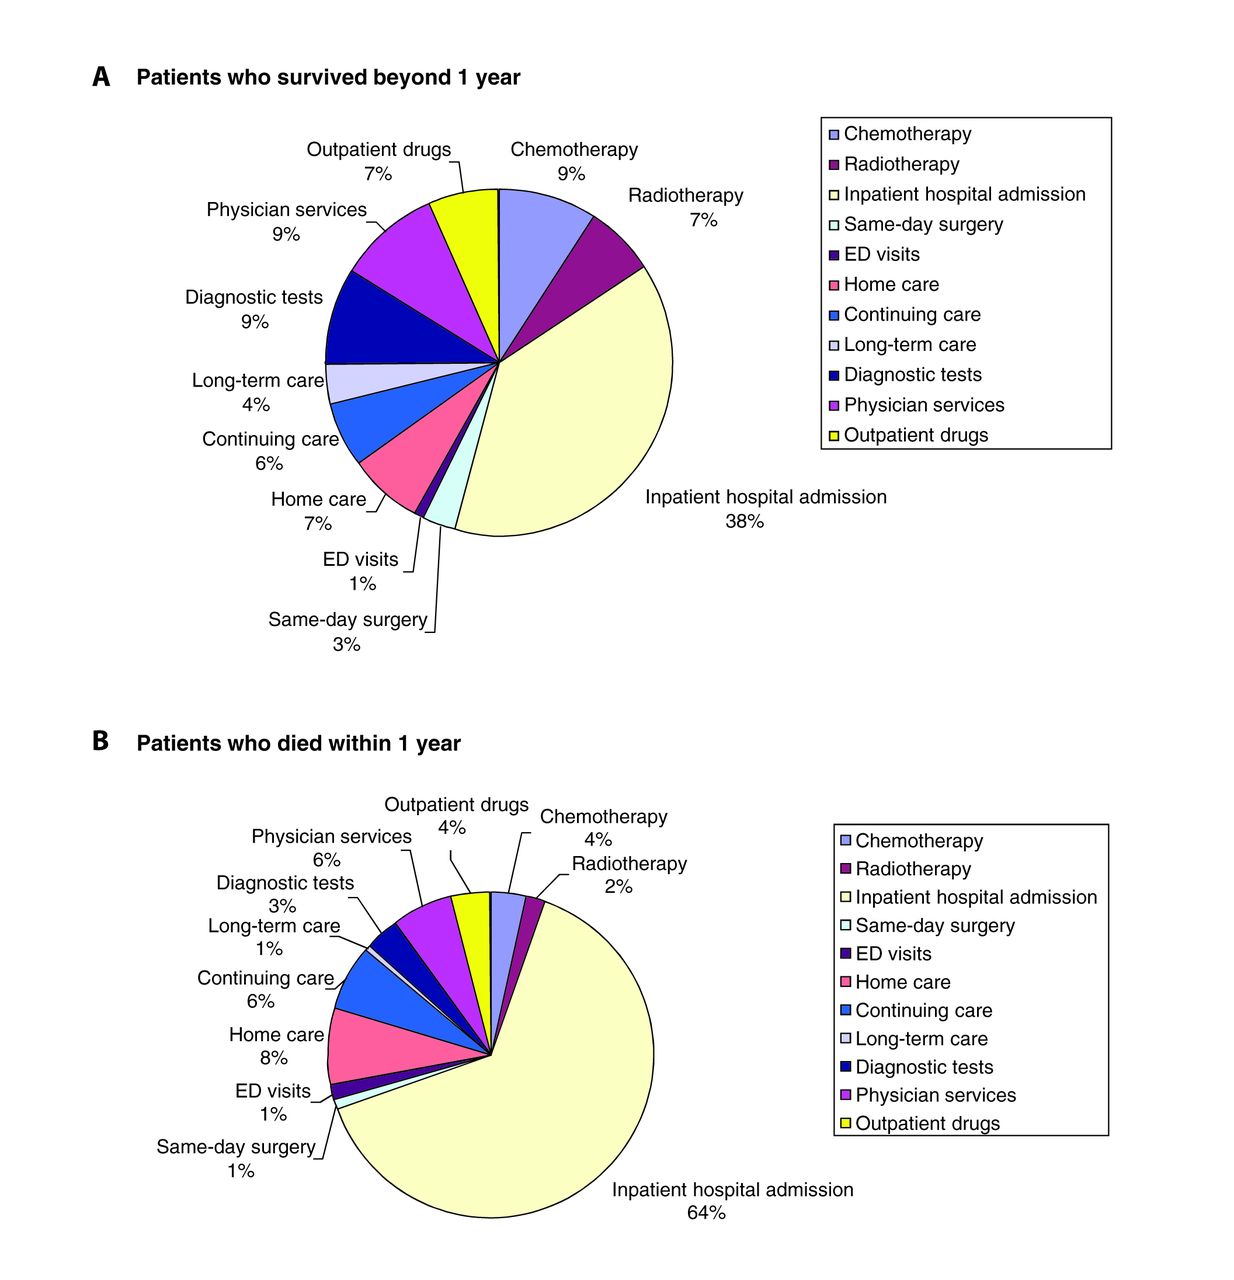
The mean overall postdiagnosis cost was $25 914 (95% CI $25 782–$26 046). The mean postdiagnosis costs were higher among the patients who died within 1 year ($39 610) than among the patients who survived beyond 1 year ($22 989). The highest costs for patients who survived beyond 1 year were for esophageal cancer ($50 620 [95% CI $47 677–$53 562]) and lowest for melanoma ($8611 [95% CI $8221–$9001]) (Figure 1A; Appendix 3, Table C). Overall, the resource categories that contributed the most to these costs were inpatient hospital admission (38%), chemotherapy (9%), physician services (9%) and diagnostic testing (9%) (Figure 2A). Among patients who died within 1 year, costs relating to cancer care were highest in the postdiagnosis phase for testicular cancer ($81 655 [95% CI $58 361–$104 949]) and leukemia ($60 615 [95% CI $58 156–$63 073]), and were lowest for liver cancer ($27 560 [95% CI $25 747–$29 373]) (Figure 1B; Appendix 3, Table D). Inpatient hospital admission contributed to 64% of the total costs, whereas chemotherapy and radiotherapy combined contributed only 6% (Figure 2B).

Breakdown of cost of cancer care by resource for the first year after diagnosis for all cancer sites in (A) patients who survived beyond 1 year and (B) patients who died within 1 year. Note: ED = emergency department. See Appendix 3 for details on each cancer site.
The results for patients aged 65 years or older were similar to the findings for our overall sample. Among patients who survived beyond 1 year, prediagnosis costs were highest for myeloma, pancreatic and brain cancers, and lowest for melanoma, head and neck, and prostate cancers. Postdiagnosis costs and respective rankings were also similar to those of the entire cohort but with a high cost for brain cancer (mean $63 672 [95% CI $57 767–$69 576]). Among patients who died within 1 year, both pre- and postdiagnosis cost estimates were in line with findings for the overall sample (data not shown).
Across LHINs, the mean first-year costs of care for prostate cancer were lower and showed less variation than costs for breast, lung and colorectal cancers (Figure 3). The geographically larger and lower population density northern LHINs (North West LHIN, Champlain LHIN and, to a lesser extent, North East LHIN) had the highest first-year costs for most cancers, whereas the geographically smaller and higher population density ones (Waterloo Wellington LHIN, except for lung cancer, and Mississauga Halton LHIN) had the lowest costs. The proportion of patients who survived beyond 1 year (for all cancers) ranged from 79.5% in North West LHIN to 85.3% in Mississauga Halton LHIN. The proportions of patients who survived beyond 1 year who had breast and prostate cancers varied by only 1.3 and 2.5 percentage points, respectively, between these 2 LHINs, but those who had colorectal and lung cancers varied by 3.5 and 4.8 percentage points, respectively.

Mean cost estimates for prostate, female breast, lung and colorectal cancers, by local health integration network.
We also applied our overall postdiagnosis cost estimates to patients diagnosed with cancer in 2009 to obtain an estimate of the total economic burden incurred by the Ontario health care system (Table 318,19). Colorectal, lung, breast and prostate cancers presented the largest financial burden for this period.
Interpretation
In this study, we estimated costs for the 3 months before diagnosis and first year after diagnosis for all types of cancer in Ontario. Costs varied by type of cancer and by patient survival, our proxy for stage of disease at diagnosis. In both survival groups, higher prediagnosis costs (> $3000) were associated with liver and pancreatic cancers, and multiple myeloma, which are often diagnosed at an advanced stage or during hospital admission.20–22 The mean postdiagnosis costs were higher among the patients who died within 1 year ($39 610) than among the patients who survived beyond 1 year ($22 989). Among the patients who died within 1 year, cancers affecting mostly younger patients, such as testicular cancer and leukemia, and commonly treated more aggressively than other cancers,23 presented the highest costs. Among the patients who survived beyond 1 year, cancers with low 5-year relative survival,24 such as esophageal and pancreatic cancers, and multiple myeloma, involved the highest postdiagnosis costs. Therefore, the highest costs for both the pre- and postdiagnosis periods occurred among patients who died within 1 year after diagnosis and who had cancers with low survival rates.
High prediagnosis costs were mainly due to diagnostic testing and hospital admissions. Postdiagnosis, the highest costs were for hospital admissions (likely because of cancer-related surgery and stem-cell transplantation for multiple myeloma22,25), chemotherapy and outpatient prescription drugs.
Esophageal cancer presented the highest postdiagnosis cost ($50 620). It also had the highest cost for hospital admissions of all cancers ($27 506), likely because of expensive procedures such as esophageal dilation for patients who underwent surgery and biopsies to the esophagus or other parts of the gastrointestinal tract (through endoscopies). These patients had frequent posttreatment follow-up visits,25 evidenced by high costs for physician services ($4757) and home care ($4058).
Our findings are generally concordant with research from the US,3 which found that first-year net costs for patients aged 65 years and older were highest for brain and other nervous system cancers ($65 409 for men and $69 908 for women, 2004 US dollars), followed by pancreatic and esophageal cancers, and lowest for melanoma of the skin. In our study, it is likely that the older patients drove the general results, because 66% of patients who died within 1 year were 65 years of age or older.
We found that patients living in northern and geographically larger LHINs had the highest total costs. One potential explanation may be that patients living in geographically remote regions may receive cancer diagnoses at later stages, thus requiring more aggressive and expensive treatment. We found that the North West LHIN had the highest proportion of patients with cancer who lived 1 year or less after diagnosis. Although our study could only describe health costs, these findings are of concern and merit further exploration.
Our results provide some insight into the economic burden incurred by the Ontario health care system. Our overall postdiagnosis cost estimates among patients diagnosed with cancer in 2009 in Ontario show that the cancers with the largest financial burden during the first year after diagnosis were colorectal, prostate, lung and breast cancers. This was owing to underlying incidence, survival and the magnitude of first-year cost estimates. If we extend these results to the Canadian population (assuming the same costs across all provinces/territories), costs from first year after diagnosis alone rise to roughly $484 million, $453 million, $267 million and $238 million for colorectal, lung, breast and prostate cancers, respectively. In 2009, Canada’s gross domestic product was about $1.5 trillion;26 if our estimates are correct, first-year costs for these 4 cancers combined would represent about 0.09% of Canada’s gross domestic product in that year.
These estimates can also help inform priorities for future research funding. In 2008, breast cancer, leukemia and prostate cancer received the greatest share of site-specific research investment in Canada in 2008 ($62.4 million, $24.3 million and $21.2 million, respectively), whereas lung and colorectal cancers were allocated only $14.7 million and $14.2 million, respectively.27 Our analysis suggests that the latter present the highest economic burden (for the first year after diagnosis in Ontario), yet receive relatively lower levels of research investment.27 The consequences of this finding require further analysis.
Strengths and limitations
Our study made use of rich administrative data and included a large population-based sample of all adults in the province of Ontario. Previous work has shown that cancer costs vary by age of the patient28 because younger patients may receive more aggressive therapy.23 Most studies from the US included only patients 65 years and older. A substantial number of patients with cancer are between the ages of 50 and 64 years (about 30% in Ontario29 and 35% of our cohort). We provided cost estimates for cancers that, to our knowledge, have not been reported previously,3 such as multiple myeloma, and that are typically more common among younger adults, such as thyroid and testicular cancers.
We used detailed costing methods and considered all resources paid for by the Ontario Ministry of Health under a comprehensive universal health care insurance plan, as has been done in the past for only a few cancers.5 Furthermore, our study is the only one, to our knowledge, to estimate prediagnosis and first-year postdiagnosis costs for all major cancers.
Our study also had limitations. We did not examine costs among children and adolescents; currently there are no estimates of costs for this group. We were not able to present cost estimates by cancer stage because this information was not available from the Ontario Cancer Registry for our analysis period. We assumed that survival less than 1 year after diagnosis indicated advanced cancer at diagnosis, but patients could have died of other causes. Furthermore, we did not look past 1 year after diagnosis to determine date of death for the patients who survived beyond 1 year, and thus we likely included some costs associated with terminal or palliative care, even for these patients.
We estimated all health care costs incurred by patients with cancer, not net cancer costs (i.e., the difference between patients with and without cancer) for 3 months before diagnosis and 12 months after diagnosis only. In the future, we will use a matched case–control costing methodology15,23,30 to estimate costs across the initial, continuing and terminal phases of care.
Conclusion
Little high-quality descriptive work has been published regarding cancer costs in Canada. Health care providers and policy-makers must have a good understanding of the resources and costs associated with cancer diagnosis and treatment to improve the quality and efficiency of cancer care and make decisions about resource allocation for cancer prevention and control. In particular, our findings have been useful in flagging additional areas of interest, such as potential geographic disparities in the cost of cancer care.
Supplemental information
For reviewer comments and the original submission of this manuscript, please see www.cmajopen.ca/content/1/1/E1/suppl/DC1
Acknowledgement
The authors thank Winson Cheung for reviewing the histology codes of the cancer sites used in this analysis.
Footnotes
-
Competing interests: None declared.
-
Contributors: Claire de Oliveira managed the overall project, contributed to the conceptualization and design of the analysis, analyzed and interpreted the data and wrote the manuscript. Karen Bremner, Reka Pataky, Kelvin Chan, Stuart Peacock and Murray Krahn contributed to the conceptualization and design of the analysis, analyzed and interpreted the data, and provided feedback on revised versions of the manuscript. Nadia Gunraj selected the patient cohort and linked it with administrative health care data housed at the Institute for Clinical and Evaluative Sciences and undertook the analyses, under the guidance of Claire de Oliveira. Nadia Gunraj revised the final version of the article. All authors have read and approved the final version submitted for publication.
-
Funding: This project was funded by a research grant from the Canadian Cancer Society Research Institute (grant no. 020200). Murray D. Krahn is supported by the F. Norman Hughes Chair in Pharmacoeconomics at the Faculty of Pharmacy, University of Toronto.
-
Disclaimer: This study was supported by the Institute for Clinical Evaluative Sciences (ICES), which is funded by an annual grant from the Ontario Ministry of Health and Long-Term Care (MOHLTC). The opinions, results and conclusions reported in this paper are those of the authors and are independent from the funding sources. No endorsement by ICES or the Ontario MOHLTC is intended or should be inferred.
References
- © 2013 Canadian Medical Association or its licensors
In this issue

Article tools


