


Abstract
Background: Ambient high temperature is associated with death; however, heat-related risk of death has not been quantified systematically in Ontario, the most populous province in Canada. Less is known about cold-related risk in this population. Our objective was to quantify the health impact from cold and hot temperatures in Ontario.
Methods: The study population consisted of all residents of Ontario who died between Jan. 1, 1996, and Dec. 31, 2010, from any nonaccidental cause. A case-crossover analysis was applied to assess the relation between daily temperature fluctuation and deaths from nonaccidental and selected causes in cold (December-February) and warm (June-August) seasons, respectively, adjusting for various potential confounders. Risk estimates were obtained for each census division, then pooled across Ontario. We examined potential effect modification for selected comorbidities and sociodemographic characteristics.
Results: In warm seasons, each 5°C increase in daily mean temperature was associated with a 2.5% increase in nonaccidental deaths (95% confidence interval [CI] = 1.3% to 3.8%) on the day of exposure (lag 0). In cold seasons, each 5°C decrease in daily temperature was associated with a 3.0% (95% CI 1.8% to 4.2%) increase in nonaccidental deaths, which persisted over 7 days (lag 0-6). The cold-related effects (lag 0-6) were stronger for cardiovascular-related deaths (any cardiovascular death: 4.1%, 95% CI 2.3% to 5.9%; ischemic heart disease: 5.8%, 95% CI 3.6% to 8.1%), especially among people less than 65 years of age (8.0%, 95% CI 3.0% to 13.0%). Conversely, heat most strongly increased respiratory-related deaths during admission to hospital (26.0%, 95% CI 0% to 61.4%). Across Ontario, each 5°C change in daily temperature was estimated to induce 7 excess deaths per day in cold seasons and 4 excess deaths in warm seasons.
Interpretation: Heat contributed to excess deaths in Ontario, although the effect of cold weather appeared to be greater. Further work is required to better define high-risk subgroups, which might include the homeless and people with inadequately heated housing.
Seasonal variations in mortality have been known for decades, and mortality is usually higher in winter than in summer.1,2 In Ontario, Canada, deaths from acute myocardial infarction and stroke peak in January and are lowest in September.3 The reasons underlying the seasonality of mortality have not been fully understood, although influenza epidemics and accidents and injuries are thought to play an important role.4-6 More recently, a growing body of evidence from the United States and Europe showed that exposure to cold temperatures may contribute to elevated mortality in the winter.7-9
Heat, on the other hand, has been associated with mortality worldwide during the summer.10-14 Despite rising concern over heat-related effects because of climate change, some recent studies have shown that cold temperatures may have a greater health impact than heat.13,15,16 For example, Gasparrini and colleagues found that cold-related death accounted for more than 1 order of magnitude more deaths than heat-related death at many locations worldwide, including selected cities in Canada.13 Similar observations were reported in a national study from the United Kingdom.16 These observations are particularly relevant to Canada, because of its cold winters and occasional severe cold spells in various regions of the country.17 However, the extent to which cold temperatures affect the Canadian population has not been well characterized.
Limited data exist as to the possible effect of cold on mortality in Canada.13,18 Among the few Canadian studies on the effect of temperature, most used broad cause-of-death classification (e.g., nonaccidental)13,18-20 and thus provided little information about the specificity of the relationship between temperature and mortality that is helpful in informing the underlying mechanisms. Even less is known as to who is susceptible to cold and hot temperatures in Canada. Given the population's vulnerability and that the ability to cope with temperature-induced effects varies substantially between regions,21,22 a better understanding of these characteristics will help protect vulnerable members of the population.
We conducted a population-based study to evaluate the extent to which cold and hot temperatures affect mortality in Ontario, the most populous province in Canada. A wide range of climates within Ontario, the extensive health outcome data available and the large population make the province an ideal setting to explore the effects of temperature on mortality in Canada.
Methods
Study design
We used a case-crossover study design to investigate the acute effects of cold and hot temperatures on mortality in Ontario. With this design, temperature exposure in the period preceding each death (case period) was compared with the exposure at a time when death did not occur (referent period). Because each case serves as its own control, this design effectively controls for known and unknown confounding factors that do not vary (or vary slowly) over time, such as smoking.23 This method has commonly been used to study temperature health effects.22,24-28 Consistent with previous studies,22,27 we selected referent periods using a time-stratified design by matching referent periods (up to 4) to the case period on the same day of the week within the same calendar month.27 This approach inherently controls for seasonal trends and day-of-the-week effects, thus reducing potential time trend biases.27
The Research Ethics Board of the University of Toronto approved the study.
Study population
The study population consisted of all residents of Ontario who died between Jan. 1, 1996, and Dec. 31, 2010, from any nonaccidental cause. The study population was assembled using the Registered Persons Database, a registry of all Ontario residents with a health insurance number.29 Deceased residents were identified through data linkage to the Ontario registrar general's death database using residents' unique, encrypted health card numbers. We ascertained underlying cause of death, date of death and residence at time of death based on postal code. People who died outside of Ontario were excluded. We selected a priori a total of 8 outcomes, including nonaccidental deaths (International Classification of Diseases codes [ninth and tenth revisions]) are listed in Appendix 1, available at www.cmajopen.ca/content/4/1/E48/suppl/DC1) and deaths from 5 cardiovascular causes (any cardiovascular, coronary heart, acute myocardial infarction, stroke, and heart failure, cardiac arrest and related), diabetes and any respiratory cause. To focus on cold and heat effects on mortality, we restricted analysis to deaths occurring in colder months (December-February) (referred to as the cold season) and warmer months (June-August) (referred to as the warm season).
Temperature data
Hourly meteorological data on air temperature, relative humidity, dew point temperature and wind speed were retrieved from Environment Canada for all weather stations in Ontario.17 For each station, we derived daily mean, minimum and maximum air temperature for both seasons during the study period, and similar metrics for wind chill and humidex. Reflecting comfort, wind chill and humidex have been widely used to issue extreme cold and heat warnings across Canada.17 More details are provided in Appendix 1.
Meteorological data were averaged across all monitoring stations within each census division (equivalent to counties) to obtain census division-wide mean daily estimates, and then assigned to study participants using their residence before death. Ontario has a total of 49 census divisions, broadly classified into 5 regions (north, west, east, central east and central west) (Appendix 1).
Potential confounding factors and effect modifiers
Daily mean concentrations of fine particulate matter (particles with aerodynamic diameter < 2.5 µm), nitrogen dioxide and daily 8-hour mean ozone were obtained for all air quality monitors in Ontario.30 Before 1998, fine particulate matter was measured on an every-sixth-day sampling schedule. Similar to meteorological data, we derived census division-wide mean daily estimates for each pollutant.
To account for potential confounding by influenza,31 we obtained daily number of physician office visits due to influenza in each census division (Appendix 1).29 We also created an indicator variable for statutory holidays.
To evaluate whether comorbidities increased people's susceptibility to the effects of temperature, we a priori ascertained the presence of hypertension, acute myocardial infarction, heart failure, diabetes, or chronic obstructive pulmonary disease (COPD) using validated Ontario registries.29 In addition, we determined whether participants were admitted to hospital within 1 year preceding death for acute myocardial infarction, heart failure, stroke, diabetes, COPD or respiratory illness using Canadian Institute for Health Information hospital discharge abstracts, based on primary and secondary diagnoses.22 We classified hospital admissions into 3 categories (within 28 days, 29 days to 1 year, and no admission within last year) to distinguish sudden deterioration of heath from chronic conditions. Furthermore, to examine whether people living in a health care facility (climate controlled) were susceptible to the impact of ambient temperatures, we determined place of death (whether or not the participant died in a long-term care facility or hospital). Among in-hospital deaths, we further distinguished deaths occurring on the day of admission (day 1) from those occurring subsequently (day 2 or beyond). Lastly, to assess whether temperature effects varied over time, we created a categorical variable for 3 time periods (1996-2000, 2001-2005 and 2006-2010).
Statistical analysis
Our analysis was carried out in 2 stages. In the first stage, we modelled the relationship between daily mortality (nonaccidental and cause specific) and daily mean temperature in each census division using a conditional logistic regression model, adjusting for relative humidity, nitrogen dioxide, ozone, influenza and holidays. Owing to considerable missing data for fine particulate matter, we did not include it in the main model but considered it in a sensitivity analysis. We fitted air pollutants using lag 0-2 (mean of the concurrent day and 2 previous days) based on evidence from published Canadian studies.32-34 We chose daily mean air temperature as our primary exposure, because it represents the exposure throughout the entire day and night.13 Cold and heat were separately analyzed.
Linearity assumption for temperatures was evaluated using restricted cubic spline functions in the model. Because we found little evidence of nonlinearity for the relationship of cold and hot temperatures with mortality in both seasons, we obtained adjusted odds ratios (ORs) and associated 95% confidence intervals (CIs) for every 5°C change in temperature,25,26 which were scaled to represent a mean percent increase in daily mortality per 5°C change for each census division. Further details on model development and linearity assumption are in Appendix 1.
In the second stage, we pooled the census division-level estimates to produce a summary estimate using a random-effect meta-analytical technique.35 We assessed potential between-census division heterogeneity using the Cochran Q statistic.36
To understand the influence of lag structures on the temperature-mortality association, we explored single-day lags of temperature exposure from 0 to 6 days before death and cumulatively for lags 0-1, 0-3 and 0-6. Because we observed that the effects of cold on mortality (nonaccidental and cause specific) lasted for 7 days (lag 0-6), whereas the effects of heat were virtually constrained to same-day exposure (lag 0), we report here effect estimates for cold at lag 0-6 and heat at lag 0.
We conducted sensitivity analyses by fitting air pollution using lag structures from 0 to 6 days and modelling other temperature measures (daily minimum and maximum air temperature, wind chill and humidex). In addition, we adjusted for snowfall when assessing cold effects because of a concern that snow shovelling or delayed transit during cold seasons might increase deaths. We restricted this analysis to 5 census divisions where snowfall data were available (Toronto, Ottawa, Hamilton, Essex and Peel). Furthermore, we controlled for fine particulate matter in a subcohort with complete data.
To identify potentially vulnerable subpopulations, we conducted stratified analyses for each census division by age, sex, place of death, history of acute myocardial infarction, heart failure, COPD, hypertension, and diabetes, as well as recent admissions to hospital for acute myocardial infarction, heart failure, stroke, diabetes, COPD and respiratory illness. The effect estimates were then pooled across Ontario.35 To avoid losing substantial power, we restricted the analyses to cardiovascular- and respiratory-related deaths, respectively. We also investigated potential effect modification by different time periods and 5 Ontario regions.
Results
The study population comprised a total of 352 818 people who died from any nonaccidental cause in Ontario in 1996-2010, after limiting to both seasons and excluding days with missing data on temperature and air pollutants (except for fine particulate matter). A total of 27 census divisions were included in the cohort, covering about 89% of the population (Appendix 1). The mean age at the time of death was 76 years, about 49% of the participants were men, 64% had hypertension and 33% died from cardiovascular disease and 9% from any respiratory cause (Table 1). In addition, the median distance of subjects' residences from a weather station was about 12 km (interquartile range 8-28 km), depending on the census division.
The 27 study census divisions showed a wide range of climates, with the median of cold-month daily mean temperatures ranging from -11.3°C in Sudbury to -1.2°C in Halton, and warm-month temperatures ranging from 15.9°C in Thunder Bay to 21.7°C in Essex (Appendix 1). Among different temperature measures, there were moderate to strong correlations, with Pearson correlation coefficients ranging from 0.61 to 0.96 (depending on season and census division) (Appendix 1). Weaker correlations were seen between temperatures and air pollutants.
On average across the 27 census divisions, there was an increase of 3.0% (95% CI 1.8% to 4.2%) in nonaccidental mortality with a 5°C decrease on cold days and 2.5% (95% CI 1.3% to 3.8%) increase in nonaccidental mortality with a 5°C increase on hot days (Figure 1). Stronger associations for cold temperature were found with death from any cardiovascular cause (4.1%, 95% CI 2.3% to 5.9%), ischemic heart disease (5.8%, 95% CI 3.6% to 8.1%) and acute myocardial infarction (5.6%, 95% CI 2.3% to 9.1%) for every 5°C decrease of daily mean temperature. Conversely, heat was most strongly linked to respiratory death (5.4%, 95% CI 0% to 11.0%) and heart failure, cardiac arrest and related death (5.1%, 95% CI -1% to 10.8%) for every 5°C increase of daily mean temperature.

Pooled mean percent change in daily mortality in association with each 5ºC decrease in daily mean temperature during cold seasons (lag 0-6) and each 5ºC increase in daily mean temperature during warm seasons (lag 0), by cause of death, across 27 selected census divisions in Ontario, 1996-2010.
At the census-division level, there were positive associations between cold and heat with nonaccidental mortality in most of the 27 study census divisions (Figure 2). The temperature effects on mortality did not differ significantly among the census divisions (p interaction = 0.07-0.91). Similar trends were seen with other cause-specific death outcomes (Appendix 1). At the regional level, the effects of cold and heat on mortality were generally consistent across the 5 Ontario regions (Figure 3).
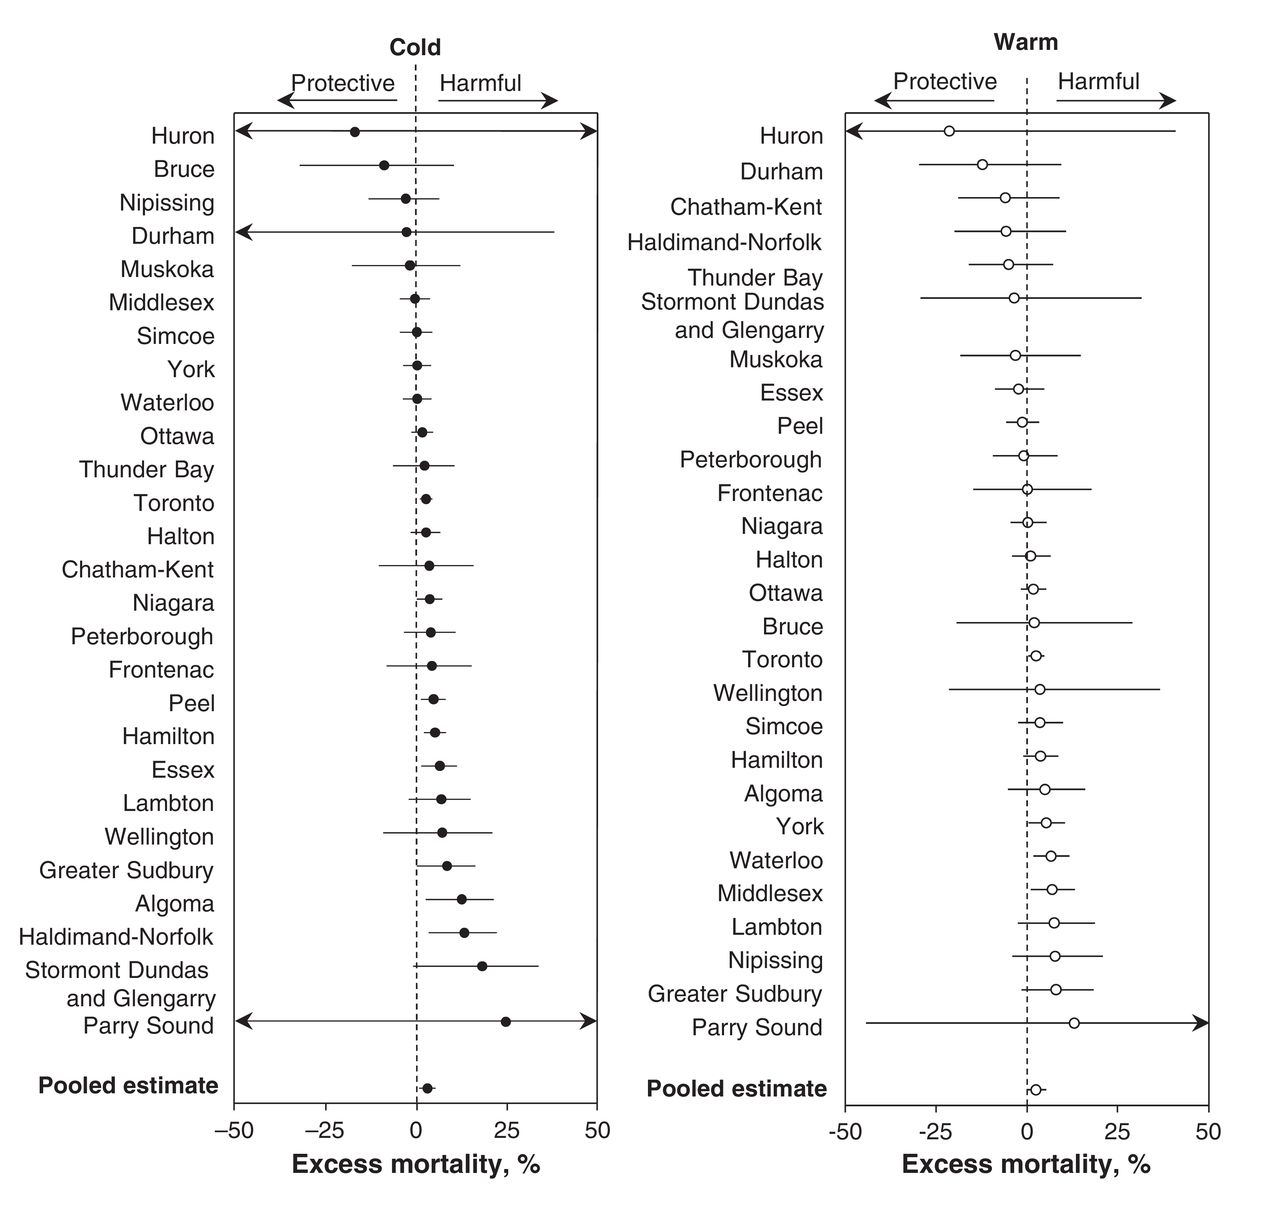
Mean percent changes in daily nonaccidental mortality in association with each 5ºC change in daily mean temperature during cold and warm seasons, across 27 selected census divisions in Ontario (cold season: lag 0-6; warm season: lag 0).

Pooled mean percent changes in daily mortality in association with each 5ºC change in daily mean temperature during cold and warm seasons, by cause of death and region in Ontario, 1996-2010 (cold season: lag 0-6; warm season: lag 0). Note: CAD = coronary artery disease, CVD = cardiovascular disease, MI = myocardial infarction, CHF = congestive heart failure.
Compared with older adults, the impact of cold on cardiovascular deaths appeared stronger for younger people (aged < 65 yr: 8.0%; 95% CI 3.0% to 13.0% v. aged ≥ 65 yr: 3.0%; 95% CI 2.0% to 5.0%, with 5°C decrease of cold temperature) (p interaction = 0.05) (Figure 4). In contrast, heat was most strongly linked to respiratory-related deaths occurring during hospital admissions (in-hospital: 26.0%; 95%CI 0% to 61.4% v. out-of-hospital: 1.4%; 95% CI -4.7% to 7.9%, with 5°C increase of heat) (p interaction = 0.08). We did not find compelling evidence supporting effect modification by selected comorbidities (p interaction = 0.12-0.94) (Figure 5). In addition, there were no clear differences in effect estimates between time periods.
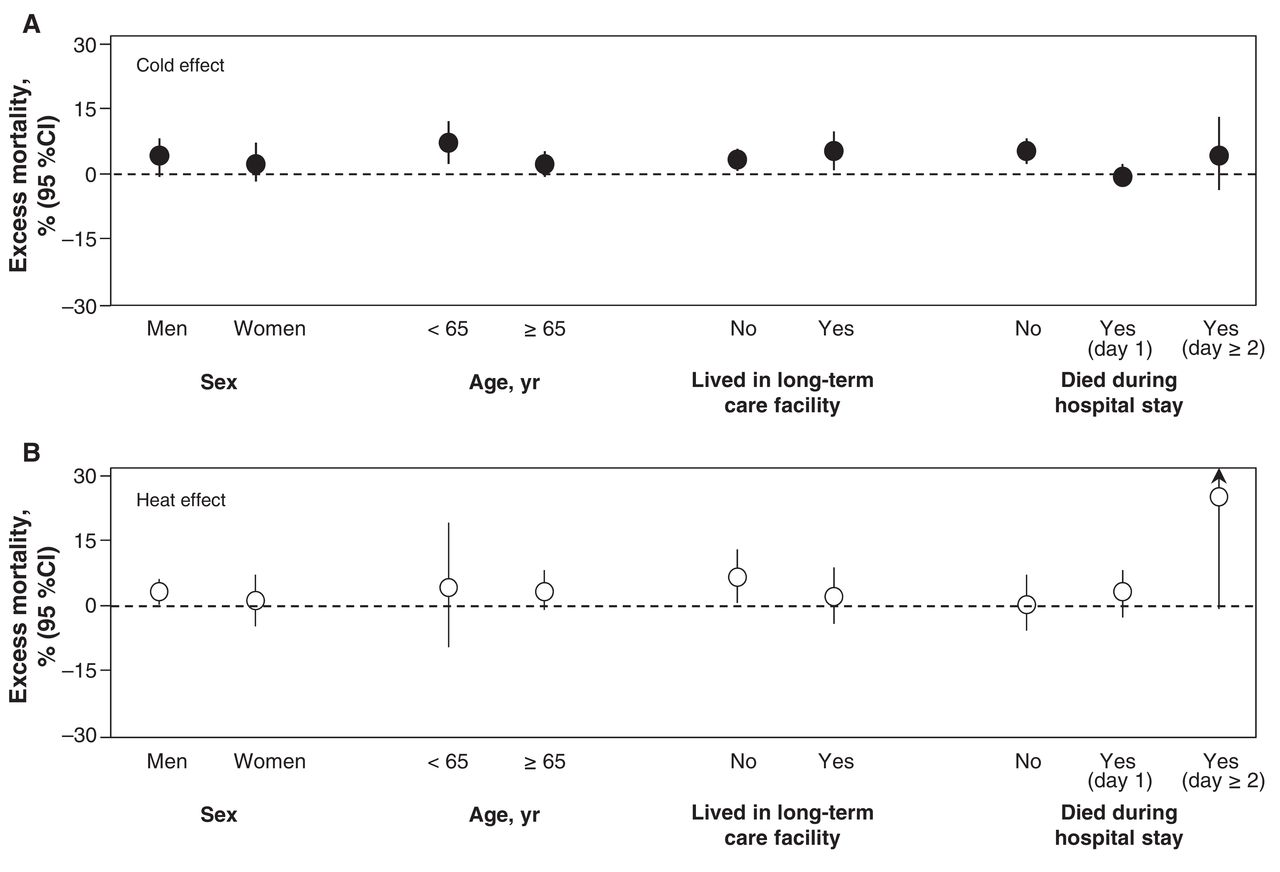
Subgroup analyses for the associations (A) between each 5ºC decrease in daily mean cold temperature and cardiovascular-related mortality, and (B) between each 5ºC increase in daily mean warm temperature and respiratory-related mortality, stratified by sex, age, long-term care residency, and in-hospital deaths, across 27 selected census divisions in Ontario, 1996-2010 (cold season: lag 0-6; warm season: lag 0).
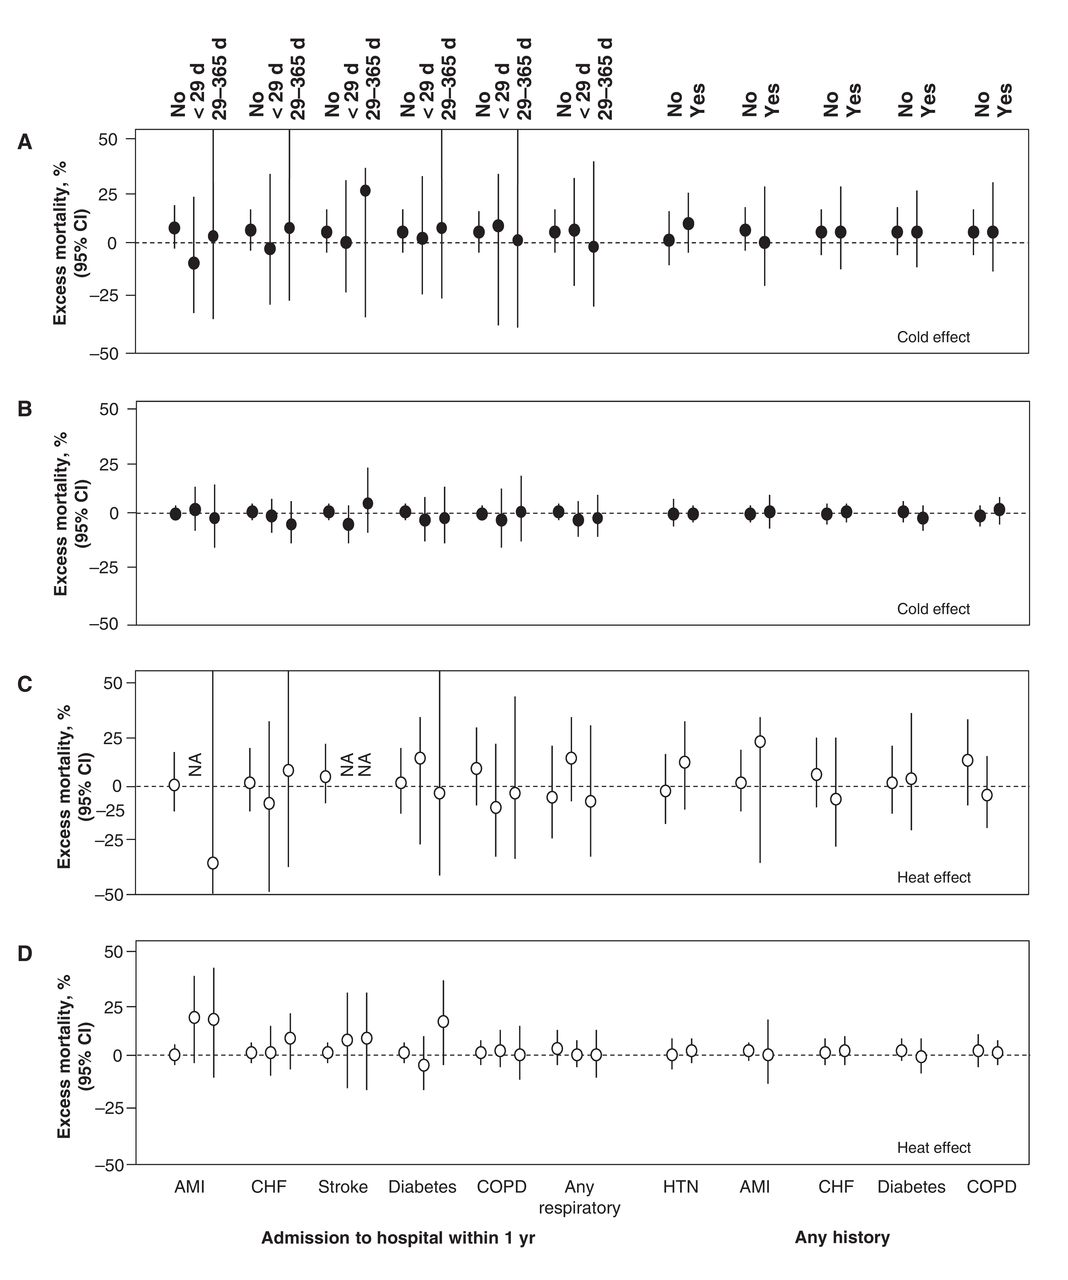
Subgroup analyses for the association between each 5ºC decrease in daily mean cold temperature and cardiovascular-related mortality for (A) age less than 65 years and (B) age greater than 65 years, and for the association between each 5ºC increase in daily mean warm temperature and respiratory-related mortality for (C) age less than 65 years and (D) age greater than 65 years, across 27 selected census divisions in Ontario, 1996-2010 (cold season: lag 0-6; warm season: lag 0). Note: AMI = acute myocardial infarction, CHF = congestive heart failure, COPD = chronic obstructive pulmonary disease, HTN = hypertension, NA = not available (i.e., number of deaths was too small).
Furthermore, the results did not alter materially after considering other temperature metrics, further adjusting for snow fall and fine particulate matter (Table 2), and fitting air pollutants with different lag structures (Appendix 1). Of note, death was more strongly associated with air temperatures than with wind chill and humidex.
Interpretation
Exposure to ambient cold and hot temperatures significantly elevated the risk of death in Ontario, with increases in daily mortality varying from 1.8% to 3.0% with a 5°C decrease of cold and from 1.6% to 2.5% with a 5°C increase of heat, depending on temperature measures. These associations were robust to sensitivity analyses and appeared stronger for cold temperatures and cardiovascular-related deaths, particularly deaths due to ischemic heart disease. Cold effects persisted over 7 days, whereas heat effects occurred immediately. In addition, heat was most strongly associated with in-hospital deaths, whereas cold appeared to affect mostly younger people (age < 65 yr). Overall, our effect estimates translate to about 7 excess deaths per day for each 5°C decrease in daily mean temperature in cold seasons across the 27 study census divisions, and 4 excess deaths per day for each 5°C temperature increase in warm seasons, based on census division-specific effect estimates and mean daily mortality over the course of study (Appendix 1).
Comparison with other studies
The findings of this study are in accordance with previous studies that have shown that increased mortality in the winter is independently associated with cold temperatures in many cities in the United States7,15,31 and Europe.8,11,37-40 Across 15 European cities, each 1°C decrease in temperature was associated with a 1.4% (95% CI 1.2% to 1.5%) increase in daily nonaccidental deaths and 1.7%, 3.3%, and 1.3% increase in cardiovascular, respiratory and cerebrovascular deaths, respectively.8 Similar associations were reported in a study involving 107 US cities.15
In this study, there is no clear relation between temperature and respiratory-related mortality in the Ontario population. However, we found important cold effects on increasing cardiovascular-related mortality, even after controlling for influenza epidemics and snow fall. Physiologically, exposure to cold temperatures is capable of increasing cardiac load by initiating inflammatory reactions and a state of hypercoagulability through elevating fibrinogen and inflammatory markers (e.g., interleukin 6), as well as plasma cholesterol and blood viscosity.9 These factors can promote thrombosis and clot formation,9 leading to myocardial ischemia and acute myocardial infarction.41,42 It is unclear if the cold effect on mortality in Ontario was partly attributable to the homeless. Our observations that cold-related mortality more likely affected those less than 65 years of age, and that the cold effect was similar in people with and without chronic conditions, suggest this plausibility.
Consistent with recent studies,13,16 we observed that cold temperature posed a greater impact on mortality in Ontario than heat. The cold effect was found to last over several days, contrasting with the heat effect, which was no longer detectable after the day of exposure. This result implies that there is more time to intervene and prevent cold-related deaths than is the case with heat, which strengthens the argument that cold-related mortality merits additional attention from a public health perspective. Another important finding is that weather parameters, such as wind chill, did not result in a better prediction of mortality compared with air temperature, suggesting that triggers for cold advisories might be better based on temperature alone rather than adding additional variables that reflect comfort more than risk to health.
Contrary to previous studies from the US and Europe that reported that heat-related risk of death was lower during admissions to hospital,22,43,44 heat-related risk of death appeared to be the highest among patients in hospital in Ontario. The stronger association could be due to chance; however, it may also relate to heightened vulnerability of patients in hospital owing to their increased frailty, the insufficient cooling environment in some hospitals, or other unknown reasons. Given the important implication, future studies with larger sample sizes are needed to confirm whether there are increased in-hospital deaths on hot days in Ontario.
It is noteworthy that recent studies from the US43 showed important variation in the temperature effects by month, with larger heat effects in the spring and early summer, and larger cold effects in late fall. Whether some communities in Ontario are at a higher risk early in the cold or warm season, especially those with a greater range in temperature extremes, remains unknown and warrants further research.
Strengths and limitations
One strength of this study is its focus on entire regions, instead of selected cities. Ontario consists of about 13.6 million residents (~40% of Canadian population),44 which allows us to study the impact of temperature on a large diverse population in Canada. As well, we obtained extensive information including air pollution, influenza activity, and snowfall, which allowed for better control for confounding. These variables are known to be associated with mortality,31 but are seldom controlled in previous studies in Canada and elsewhere. Aspects of the case-crossover approach also reduce concerns about confounding. The use of a time-stratified design in selecting referent periods further reduces time trend biases. Furthermore, our study benefited from having information on the cause and the place of death and medical history, allowing for temperature effects to be analyzed in more detail and thus providing important insight into mechanisms underlying temperature-related mortality in Ontario.
Several limitations merit mention. First, we determined temperatures on the basis of regional estimates from weather stations, which may have led to exposure error because of variability at individual residences and in daily activity patterns. However, previous studies in which both monitoring data and spatial models were used to predict temperature at residence found similar risk estimates.45,46 Nonetheless, given the inherent imprecision of these spatially derived exposures, our assessment of exposure was likely subject to nondifferential misclassification that would attenuate our estimates. In addition, the use of death certificates may result in misclassification of death causes that were likely independent of exposure. This may further lead to an underestimation of the true effect.
Second, similar to previous studies of temperatures using case-crossover design, we did not assess a longer lag period for cold effects, due to a concern that some control periods would overlap with exposure periods, which can lead to increasing collinearity and loss in statistical power. Our inability to incorporate a longer lag might have resulted in an underestimation of overall cold effects. However, recent studies showed that cold effects were delayed for 2 days and lasted for about a week in selected Canadian cities.13,19 As well, we did not incorporate the full range of distribution of exposures because our analyses were focused on the summer and winter months. As a result, we were unable to estimate the impact of temperatures on days in other seasons of the year.
Third, homeless people are likely among the groups most vulnerable to cold effects, in addition to people who live in marginal housing where adequate indoor temperatures cannot be maintained. However, we were unable to identify such participants using administrative databases. In addition to death, morbidity, such as frostbite and respiratory-related admissions to hospital, has also been linked to temperature47 and requires further investigation.
Conclusion
This study adds weight to previous observations that both cold and heat may significantly increase mortality and provides new evidence that health effects from cold temperatures appear greater than those of heat in Ontario. Our findings indicate that greater public health attention to cold-related mortality is required. Further research to better understand high-risk groups, which likely include the homeless and people with inadequately heated housing, may help target effective preventive measures.
Supplemental information
For reviewer comments and the original submission of this manuscript, please see www.cmajopen.ca/content/4/1/E48/suppl/DC1
Acknowledgements
Acknowledgement: The authors thank Mark Goldberg (McGill University, Montréal) for advice and suggestions in the preparation of this paper.
Footnotes
Competing interests: None declared.
Contributors: All of the authors contributed to the conception and design of the study, acquisition and interpretation of the data, and drafting and revising of the manuscript. All of the authors approved the final version submitted for publication and agreed to act as guarantors of the work.
Funding: This study was supported by a contract from Health Canada (contract no.: 4500302837).
Disclaimer: This study was supported by the Institute for Clinical Evaluative Sciences (ICES), which is funded by an annual grant from the Ontario Ministry of Health and Long-Term Care (MOHLTC). The opinions, results and conclusions reported in this article are those of the authors and are independent from the funding sources. No endorsement by ICES ot the Ontario MOHLTC is intented or should be inferred.
References
- Copyright 2016, 8872147 Canada Inc.
In this issue

Article tools


Related Articles
Cited By...
- No citing articles found.