


Abstract
Background: The inhalation of naturally occurring radon (222Rn) gas from indoor air exposes lung tissue to α-particle bombardment, a highly mutagenic form of ionizing radiation that damages DNA and increases the lifetime risk of lung cancer. We analyzed household radon concentrations and risk factors in southern Alberta, including Calgary, the third-largest Canadian metropolis.
Methods: A total of 2382 residential homes (2018 in Calgary and 364 in surrounding townships) from an area encompassing 82% of the southern Alberta population were tested for radon, per Health Canada guidelines, for at least 90 days (median 103 d) between 2013 and 2016. Participants also provided home metrics (construction year, build type, foundation type, and floor and room of deployment of the radon detector) via an online survey. Homes that were subsequently remediated were retested to determine the efficacy of radon reduction techniques in the region.
Results: The average indoor air radon level was 126 Bq/m3, which equates to an effective absorbed radiation dose of 3.2 mSv/yr. A total of 1135 homes (47.6%) had levels of 100 Bq/m3 or higher, and 295 homes (12.4%) had levels of 200 Bq/m3 or higher; the range was less than 15 Bq/m3 to 3441 Bq/m3. Homes built in 1992 or later had radon levels 31.5% higher, on average, than older homes (mean 142 Bq/m3 v. 108 Bq/m3). For 90 homes with an average radon level of 575 Bq/m3 before mitigation, radon suppression successfully reduced levels to an average of 32.5 Bq/m3.
Interpretation: Our findings show that radon exposure is a genuine public health concern in southern Alberta, suggest that modern building practices are associated with increased indoor air radon accumulation, legitimatize efforts to understand the consequences of radon exposure to the public, and suggest that radon testing and mitigation are likely to be impactful cancer prevention strategies.
Radon (222Rn) gas arises from the radioactive decay of radium-, thorium- and uranium-bearing soils and bedrock and is prevalent in the North American Prairies. Radon permeates through soil under high pressure toward low- or negative-pressurized areas such as basements. As homes are heated and thermal stacking generates pressure differentials, radon is actively drawn up through foundations to accumulate within indoor air.
Radon inhalation is the greatest source of lifetime radiation exposure,1 correlating with increased rates of lung and hematologic malignant disease, melanoma, kidney cancers and certain childhood cancers.2-5 It is estimated to be responsible for 2% of all cancer deaths.2-5 Radon has a 3.8-day half-life, with 50% decaying in that time to radioactive polonium and emitting α-particle radiation, which is, dose-for-dose, substantially more dangerous to health than x-rays or γ-rays.6,7 Radon decay within the lungs leads to tissue α-particle bombardment and precipitation of solid polonium within lung mucosal linings; precipitated polonium attached to household dust can also be inhaled.3 Radon decay products emit multiple α particles and β particles before becoming solid lead-210. Alpha particles carry enough energy to remove electrons from other molecules, leading to ionization. DNA is easily ionized by α particles and breaks apart as α particles travel through tissue, generating difficult-to-repair DNA damage that has a significantly higher dose effect than γ-rays.6-8 DNA damage leads to genetic mutation that increases cancer risk with each new α-particle emission.9
Radiation is measured in becquerels (Bq); 1 Bq is defined as the activity of a quantity of radioactive material in which 1 nucleus decays per second. Radon concentrations are expressed as Bq/m3 air, with 100 Bq/m3 increasing the lifetime risk of lung cancer by 16%.10 Health Canada indicates that 200 Bq/m3 represents the maximum acceptable exposure before certain and serious health risks.11 Anyone aged 65 years or less who chronically inhales radon is at increased risk for lung cancer in their lifetime, with children and teens most affected.4,12-14 Globally, 25% of patients with lung cancer are nonsmokers, and most cases of the disease in developed countries are caused directly by radon inhalation in homes and workplaces.15-17 In the Canadian province of Alberta, lung cancer is diagnosed in 2150 people yearly, with mortality at 1610 deaths/year; of the 2150, 358 are never-smokers.11,18Cancer prevention is preferable to the physical, emotional, social and economic cost of cancer diagnosis and therapy. Radon prevention represents an effective way to reduce cancer burden. Motivated by this, our objective was to measure household radon levels in southern Alberta, correlate levels with home metrics and examine the effectiveness of remediation strategies.
Methods
Setting and design
In 2016, Alberta was populated by about 4.25 million people, with about 1.68 million in the southern region (defined as Statistics Canada census regions 1-6 and 15). Our survey region encompassed the City of Calgary, Cochrane, Okotoks, Airdrie, Canmore, Bragg Creek, Chestermere, High River, De Winton, Redwood Meadows and surrounding rural "municipal districts" - a region representing 82% of the southern Alberta population (about 1.37 million) as defined above. From 2013-2016, residents purchased α track radon detectors (Radtrak2, Landauer Radon, Inc.) as part of a study entitled the "Citizen Scientist" Household Radon Testing Project. Public outreach was achieved through print and online media as well as television and radio in an untargeted manner. Homeowners and renters were equally eligible. Residents purchased radon detection kits for $45 each; the kits were supplied and distributed (by post) centrally by our study. Once the test was completed, participants returned the detector via post in supplied labelled shipping boxes directly to Landauer Laboratories in the United States. Participants consented to semianonymously provide long-term average radon readings and home metrics (via an online survey); the data were associated only with forward sortation area (a geographical region in which all postal codes start with the same 3 characters). The online survey was developed in year 1 of the study and elicited the following basic information: home construction year, build type, foundation type, and floor and room of deployment of the radon detector (see Appendix 1, available at www.cmajopen.ca/content/5/1/E255/suppl/DC1). Rigorous care was taken to educate participants in the correct test deployment methods through communication with professionals certified by the Canadian - National Radon Proficiency Program (C-NRPP).
Data collection
Commercial buildings, apartment blocks and mobile homes were excluded from the study. The radon detectors were closed passive etched-track detectors made from CR-39 plastic film inside antistatic holders enclosed in electrically conductive housing with filtered openings to permit gas diffusion, intended for long-term (> 90 d) use. They had a typical linear range of 15-25 000 Bq/m3. To be read, CR-39 films are etched in 5.5N sodium hydroxide at 70°C for 15.5 minutes and scored with the use of TrackEtch software at Landauer Laboratories, which is accredited by the C-NRPP (ISO 17025 certified). Controls included duplicates to ensure device reproducibility, spiked positives to ensure accuracy and undeployed negatives to control for transport and storage before analysis. Readings are in Bq/m3 rounded to the nearest whole number. We also collected follow-up data from households with radon levels of 200 Bq/m3 or greater that opted for mitigation, which mostly involved subslab depressurization; in a minority of cases, radon-impermeable membrane installation was used.
Statistical analysis
We carried out statistical analysis using SPSS software; unreported data were excluded. In the general linear model, radon concentrations were transformed, to the natural log, to meet model assumptions. We used type III sum of square in the general linear model because of the unbalanced data set (e.g., for home type), and year of construction was considered as a confounding covariate and was controlled for. Significance was set at p < 0.05. We carried out one-way analyses of variance to test radon levels among groups (home metrics/year of construction/forward sortation area), with Bonferroni post hoc testing.
Results
Household radon levels in the Calgary metropolitan region
Of the 2978 detectors sent out, 2382 (80.0%) were returned and were eligible for analysis; the remaining detectors were not deployed correctly during the appropriate testing window or, in a minority of cases, the test was spoiled by user error. Of the 2382 homes, 2018 were in Calgary and 364 were in surrounding townships (Airdrie East, Canmore, Central Foothills, Cochrane, High River, Kananaskis Improvement District, Okotoks, Redwood Meadows, Chestermere and Symons Valley), which accurately reflected the population distribution of the region. Of the 2382 detectors, 2370 (99.5%) were deployed between October and April; the median test duration was 103 days.
Indoor air radon levels varied considerably, ranging from less than 15 Bq/m3 to 3441 Bq/m3, and varied across all forward sortation areas (Figure 1). A total of 1135homes (47.6%) had levels of 100 Bq/m3 or higher, and 295 (12.4%) had levels of 200 Bq/m3 or higher. The average reading was 126 Bq/m3. The average in some regions was slightly higher, but there were no areas with uniformly low household radon levels, and all areas contained homes with a radon level well above the maximum acceptable limit for Canada (200 Bq/m3) (Figure 2). Cochrane (261 Bq/m3) and Okotoks/High River (194 Bq/m3) had the highest average radon readings. The average reading for the four quadrants of Calgary was 115 Bq/m3 to 122 Bq/m3 (Figure 2). To validate geographical effects, we grouped readings by forward sortation area. After excluding low-reporting areas (n < 10), we were left with 34 areas. There was a statistically significant difference in household radon levels between forward sortation areas (f[33 2045] = 3.272, p < 0.001). Average radon readings in Cochrane were significantly different from those in 26/34 regions (p < 0.05), and average readings in High River were significantly different from those in 1 area in Calgary southeast (p < 0.05). No areas within Calgary city limits differed in a statistically significant sense.

Indoor air radon concentrations by postal code district in the greater Calgary metropolitan region. Darker-coloured circles indicate multiple overlapping readings. High radon concentrations were documented almost universally across the region.
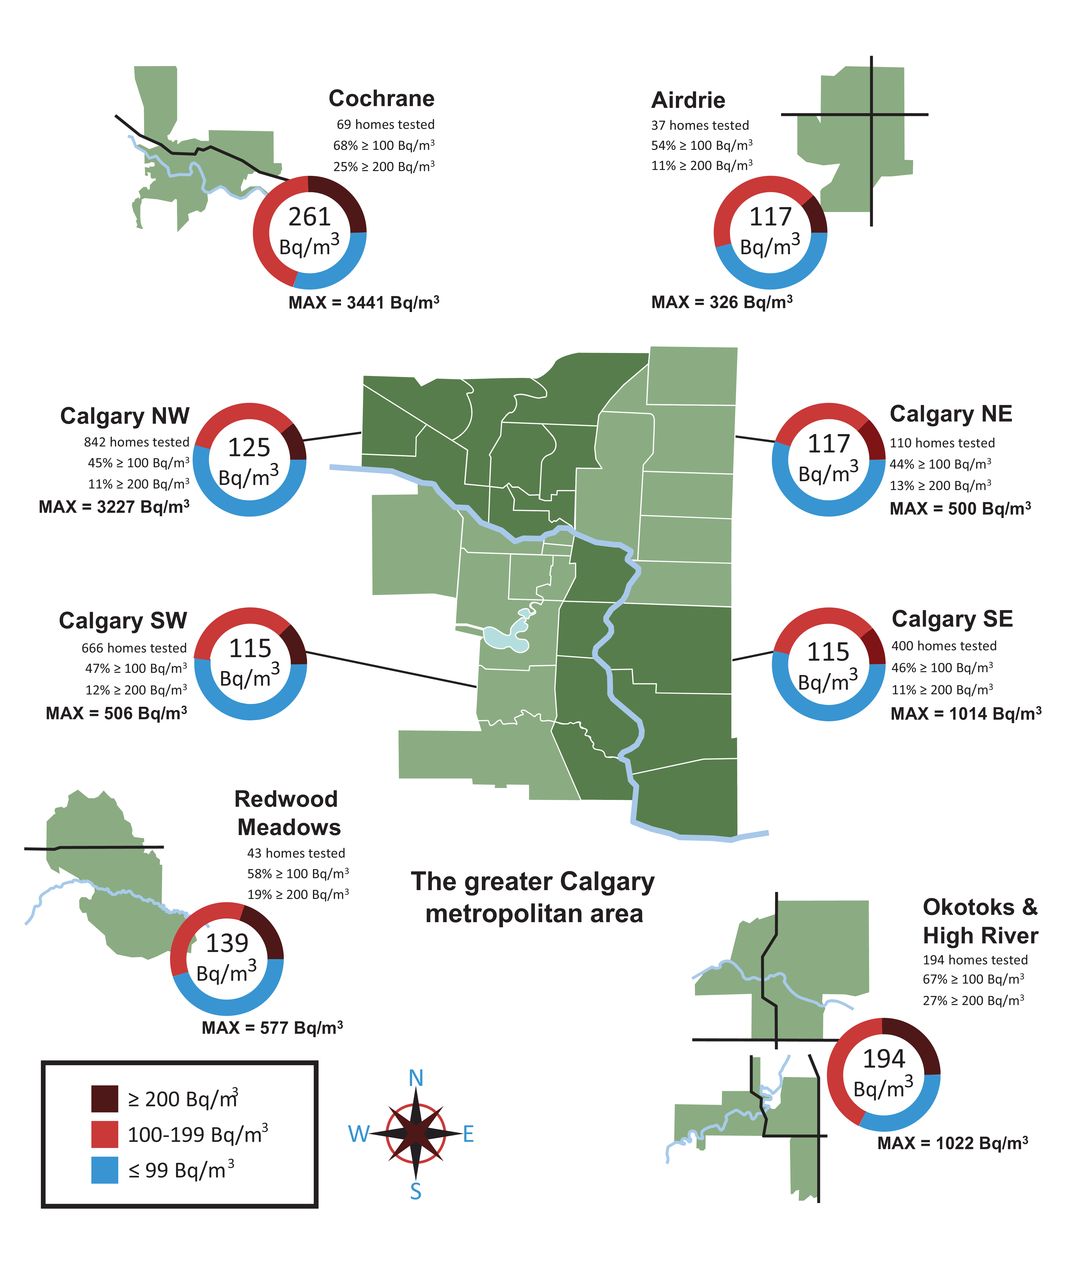
Average indoor air radon concentrations by subdivision of the greater Calgary metropolitan area and proportion of homes with readings of ≤ 99 Bq/m3, 100-200 Bq/m3 and > 200 Bq/m3 for the 4 quadrants of Calgary and the surrounding towns. Max = maximum observed radon reading in area.
Radon levels by home features
Our home metrics survey allowed us to examine factors associated with radon levels (Table 1). Basements had significantly higher radon levels than ground or first floors (p ≤ 0.001), and utility spaces had higher levels than living spaces (p < 0.001) (Figure 3). We also performed general linear model analysis to test for the influence of multiple variables on indoor radon (f[150 1332] = 2.226, p < 0.001). To isolate the effect of home metrics, year of construction was controlled for. Of the tested effects, only 2 were at or close to statistical significance: [build × room × area] and [build × area] (p < 0.05) (Table 2).

Average indoor air radon concentrations by home features. Box plots show minimum/maximum spread and mean of radon concentrations within home descriptor groupings (*p ≤ 0.001, Bonferroni post hoc testing on one-way analyses of variance).
Radon levels by home age and mitigation results
We found a strong correlation between home construction year and radon concentration. Median and average radon levels for homes built in or after 1992 (average 142 Bq/m3, median 103 Bq/m3) were significantly higher than levels for older homes (average 108 Bq/m3, median 85 Bq/m3), U = 653 867.500, z = 6.203, p < 0.001) (Mann-Whitney test) (Figure 4, A). An unbiased survey of 1632 area homes listed for sale during 2016 showed that the home age distribution of our study was comparable to norms of the region (Figure 4, B). While conducting the survey, we recorded home floor-plan sizes; these have doubled over the past 65 years: the average size of homes built in 1992-2016 was 2384.9 ft2 (n = 914), compared to 1578.9 ft2 for those built before 1992 (n = 725) (Figure 4, C).

A: Indoor air radon measured in homes built before 1992 and in those built between 1992 and 2016. B: Home age distribution for homes in our study (red line) and for a random sampling of homes listed for sale in 2016 in the same region (black line). C: Reported square footage of homes constructed between 1940 and 2016, indicating individual home sizes (red dots) and averages across decades.
For 90 homes with an average radon level of 575 Bq/m3 before mitigation, radon suppression successfully reduced levels to an average of 32.5 Bq/m3. In the most striking case, a level of 3441 Bq/m3 was reduced by 97.5% to 86 Bq/m3 (Figure 5).
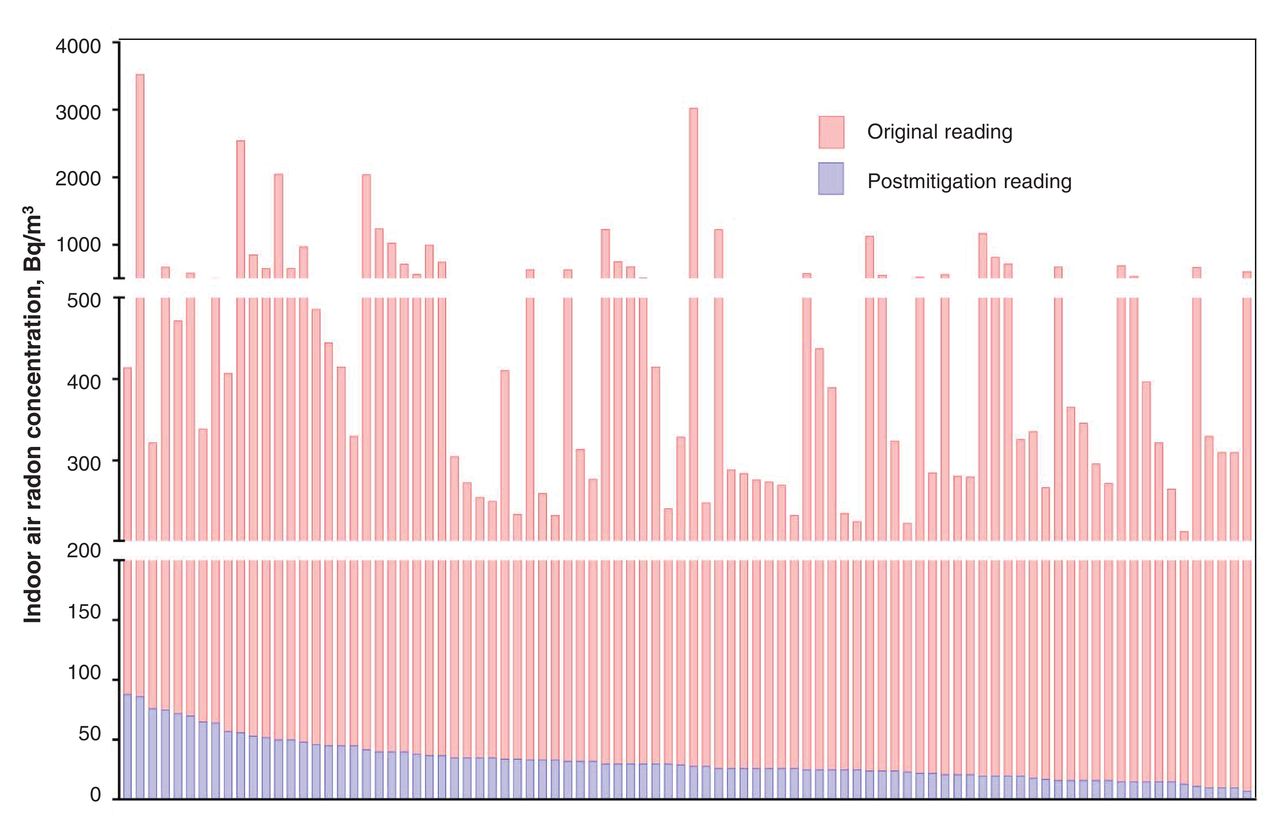
Pre- and postmitigation indoor air radon concentrations for all homes with initial readings of 200 Bq/m3 or higher.
Interpretation
We found that 47.6% of 2382 southern Alberta homes tested had indoor air radon levels of 100 Bq/m3 or higher, and 12.4% were at or exceeded the Health Canada guideline of 200 Bq/m3. Homes built in 1992 or later had radon levels that were, on average, 31.5% higher than those in older homes. The slightly higher radon levels observed in basements and utility spaces are likely due to reduced ventilation and proximity to radon entry points. Mitigation was effective at reducing radon levels to below 100 Bq/m3 in all cases and typically reduced levels by 92%.
Our data indicate a strong correlation between construction year and indoor air radon level, whereas geographical location (within this region) was not an effective predictor. These findings suggest that millennial home-engineering practices may be creating environments that accumulate radon in greater indoor air concentrations. We speculate that this may be due to the following factors:
• Energy-efficient home insulation practices reduce heat loss but also often suppress air exchange. Indeed, increasing airtightness can elevate mean radon concentrations by 56.6%.19 This effect makes radon a more pressing concern in countries with colder climates such as Canada.
• Home floor-plan sizes in Alberta have steadily increased over time. Since concrete contracts as it cures in a fixed ratio with the size of poured slab,20,21 larger floors are subject to greater shrinkage and, consequently, larger floor-to-foundation gaps, enabling more radon entry. This is likely exacerbated by the fact that concrete shrinkage has increased, reportedly owing to a scarcity of good-quality aggregates and subsequent use of recycled concrete with mineral additives (such as fly ash).22
• Building height has also increased over time, with 2- to 3-storey homes with vaulted ceilings becoming the norm. Like taller chimneys, loftier homes exhibit potent thermal stack effects that generate powerful negative pressures at basement level, which draw up ever more radon into indoor air.
We found higher indoor radon concentrations than reported in the Cross-Canada Survey of Radon Concentrations in Homes,11 which showed that 8.1% of 86 Calgary Health Region homes had levels of 200 Bq/m3 or higher, with none higher than 599 Bq/m3. Our data, based on 2382 readings in the same region, showed that 12.4% of homes had levels between 200 Bq/m3 and 3441 Bq/m3, higher than the proportion of Canadian homes as a whole (6.9% ≥ 200 Bq/m3) and in line with estimates for Manitoba (19%) and Saskatchewan (9%).11 According to the United Nations Scientific Committee on the Effects of Atomic Radiation, 100 Bq/m3 equates to 2.5 mSv/yr absorbed by adult lungs.23 Hence, our average of 126 Bq/m3 for the region equates to 3.2 mSv/yr, and our most extreme case, 3441 Bq/m3, equates to 86.0 mSv/yr. Radiobiologists estimate that 50 mSv produces about 1 DNA double-strand break per cell, a genetic-mutation-promoting event capable of shearing entire chromosomes.24 Even assuming that 90% of DNA damage is repaired without genetic error, that equates to 736 million mutations/lung per year in a person inhaling 200 Bq/m3 of radon.25Census data estimate our study region to contain 463 682 single-family residences. Applying our finding of 12.4% of homes with indoor air radon levels of 200 Bq/m3 or higher, this equates to about 57 500 homes or, considering occupants per household (2.6), about 150 000 residents - a substantial population whose lifetime risk of lung cancer is avoidably increased.26,27 Our data also suggest that occupants of basement suites (a common practice in the region) are exposed to higher radon levels and that populations at risk from radon (12.4%) are comparable to those at risk for tobacco-related cancer, as smoking rates in Alberta are 19%.28
Strengths and limitations
We not only analyzed radon levels by region (the historic norm for previous work11) but also correlated them with certain metrics of Canadian-built homes. Although there may be interactions between build type and location, we conclude that such a correlation is only weakly shown, and more balanced data (e.g., single-family detached homes represented > 90% of build type in our study) are needed to test this further. For some home metric variables, we fell short of a 100% response rate (average 89%). Our survey was a convenience sample achieved through local public outreach, whereas the Health Canada survey11 was a random sample contacted through telephone survey; however, the same guidelines were used to collect the 2 data sets. Our sampling through public outreach may have resulted in selection bias, although the outreach was untargeted and we accepted all valid data from southern Alberta residents, which potentially minimized this possibility. Our study likely excluded residents whose homes had previously been tested for radon, as subsequent tests may have been viewed as redundant; however, we consider this unlikely to have biased our outcomes. Costs incurred by the participants may have also biased our sample group, although, based on our data, this did not affect home age or geographic distribution within our study compared with regional norms. Overwhelmingly, participants were first-time radon testers. We consider it unlikely that willingness to participate might have biased results toward lower or higher radon readings.
Our work focused entirely on noncommercial residences. In future, it will be important to encompass such constructions as daycares and workplaces. Based on census information, City of Calgary residences are 55.8% single-family homes, 6.6% duplexes, 22.6% condominiums/apartments, 10.6% townhouses and 4.4% other.26 Our data set comprised 92% single-family detached homes, 5% duplexes, 0.5% condominiums/apartments and 2.5% townhouses, which indicates an (intended) underrepresentation of apartment blocks as, based on occupancy, more than 5 times the regional population live in single-family detached homes than in condominiums/apartments.26 As such, our sample actually covers the most at-risk and largest section of the population of interest.
Conclusion
Our findings show that radon, an established carcinogen, is of genuine concern in southern Alberta and legitimatize efforts to understand the consequences of radon exposure to public health. Roughly 2000 Albertans are diagnosed with lung cancer annually, of whom about 15% are never-smokers. We have shown that 48% of area homes had indoor air radon levels of 100 Bq/m3 or higher and 12% were at or exceeded the maximum acceptable limit for Canada of 200 Bq/m3. Although homes built in 1992 or later contained significantly higher radon levels than older homes, signifying an increasing public health hazard, remediation methods were effective at reducing radon concentrations. This suggests that radon testing and mitigation are likely to be impactful cancer prevention strategies.
Supplemental information
For reviewer comments and the original submission of this manuscript, please see www.cmajopen.ca/content/5/1/E255/suppl/DC1
Acknowledgements
Acknowledgement: The authors thank all the southern Alberta "citizen scientists" who participated in the study.
Footnotes
Competing interests: None declared.
Contributors: Aaron Goodarzi conceived and designed the study. Colin Dumais, Karin Dumais and Renata MacQueen designed the methods and collected the data. Siavash Zarezadeh and Fintan Stanley analyzed all data. Aaron Goodarzi and Fintan Stanley drafted the manuscript and figures. All of the authors participated in outreach to general public and manuscript preparation, approved the final version to be published and agreed to act as guarantors of the work.
Funding: Aaron Goodarzi's laboratory is supported by the Canadian Institutes of Health Research. Aaron Goodarzi is currently the Canada Research Chair for Genome Damage and Instability Disease, and this work was carried out, in part, thanks to funding from the Canada Research Chairs program.
References
- Copyright 2017, Joule Inc. or its licensors
In this issue

Article tools


Related Articles
Cited By...
- No citing articles found.