


Abstract
Background: In pandemics, local hospitals need to anticipate a surge in health care needs. We examined the modelled surge because of the coronavirus disease 2019 (COVID-19) pandemic that was used to inform the early hospital-level response against cases as they transpired.
Methods: To estimate hospital-level surge in March and April 2020, we simulated a range of scenarios of severe acute respiratory syndrome coronavirus 2 (SARS-CoV-2) spread in the Greater Toronto Area (GTA), Canada, using the best available data at the time. We applied outputs to hospital-specific data to estimate surge over 6 weeks at 2 hospitals (St. Michael’s Hospital and St. Joseph’s Health Centre). We examined multiple scenarios, wherein the default (R0 = 2.4) resembled the early trajectory (to Mar. 25, 2020), and compared the default model projections with observed COVID-19 admissions in each hospital from Mar. 25 to May 6, 2020.
Results: For the hospitals to remain below non-ICU bed capacity, the default pessimistic scenario required a reduction in non-COVID-19 inpatient care by 38% and 28%, respectively, with St. Michael’s Hospital requiring 40 new ICU beds and St. Joseph’s Health Centre reducing its ICU beds for non-COVID-19 care by 6%. The absolute difference between default-projected and observed census of inpatients with COVID-19 at each hospital was less than 20 from Mar. 25 to Apr. 11; projected and observed cases diverged widely thereafter. Uncertainty in local epidemiological features was more influential than uncertainty in clinical severity.
Interpretation: Scenario-based analyses were reliable in estimating short-term cases, but would require frequent re-analyses. Distribution of the city’s surge was expected to vary across hospitals, and community-level strategies were key to mitigating each hospital’s surge.
The coronavirus disease 2019 (COVID-19) pandemic caused by severe acute respiratory syndrome coronavirus 2 (SARS-CoV-2) has led to 127 940 detected cases and 9117 deaths by Aug. 30, 2020, in Canada. 1 By early March 2020, there was growing evidence from China of COVID-19 causing severe lung disease and critical illness requiring intensive care.2 Thus, an important component of responding to local onward transmission in Canada in March 2020 was preparing for a surge in inpatient and intensive care needs for patients with COVID-19.3–5
In Canada’s health care system, national, provincial and local public health agencies provide guidance surrounding pandemic preparedness in the clinical setting, with implementation conducted within health care facilities. Decentralized implementation and hospital-level decision-making played a major role in the COVID-19 outbreak.6 Hospital-level pandemic planning teams integrated information on their local bed capacity, baseline admissions and anticipated surge to help prepare their respective hospitals.4
To support hospital-level pandemic planning in the Greater Toronto Area (GTA) during March and April 2020, we developed an epidemic model and used publicly available data and provincial administrative health care data to simulate the range of plausible epidemic trajectories and hospital care needs anticipated for the GTA. We applied outputs from the epidemic model to hospital-specific data to estimate the early, 6-week trajectory and daily volume of inpatient and intensive care surge at 2 downtown, acute care hospitals in the GTA from Mar. 25 to May 6, 2020. We then compared the scenario-based projections to the observed hospital-specific COVID-19 inpatient census from Mar. 25 to May 6, 2020.
Methods
Study setting
The GTA has a population of 6 million and includes 5 regions7–10 with 40 acute care hospitals.11 By Mar. 25, 2020, there were 544 diagnosed cases of COVID-19 in the GTA.12–17 St. Michael’s Hospital (quaternary care) and St. Joseph’s Health Centre (tertiary care) are part of Unity Health Toronto, a network of 2 acute care facilities and 1 long-term continuing care facility. The Unity Health Toronto COVID-19 Incident Management Team was formed on Jan. 27, 2020, and requested rapid modelling in early March to estimate potential surge in health care needs at each hospital. Preliminary results were provided to the Incident Management Team on Mar. 4, 2020, and updated in late March using the constrained scenarios for a 6-week projection from Mar. 25 to May 6, 2020.
Model design
We developed a deterministic, compartmental, mathematical model of SARS-CoV-2 person-to-person transmission, and simulated a closed population (no births or deaths) over a 300-day period. For the current analyses, we did not stratify the modelled population by age, and thus, we assumed a homogenous population. Figure 1 depicts the model structure, in which the biological component follows a susceptible–exposed–infectious–recovered system, and the health care component includes inpatient and intensive care unit (ICU) admissions. The model was written in R scripting language (source code available at our GitHub Repository18) and is detailed in Appendix 1, available at www.cmajopen.ca/content/8/3/E593/suppl/DC1. An R Shiny user interface was created for the model.19

Transmission model structure. Compartments represent health states, with transitions between health states in a stable population of fixed size. A proportion of individuals infected with severe acute respiratory syndrome coronavirus 2 (SARS-CoV-2) develop severe coronavirus disease 2019 (COVID-19) and require admission to hospital. Among individuals with nonsevere COVID-19, a proportion self-isolate after receiving a diagnosis of confirmed or syndromic COVID-19 or may self-isolate without a diagnosis; the remainder do not self-isolate. Only a subset of individuals with nonsevere COVID-19 receive a confirmed diagnosis if they undergo testing. Individuals in the infectious health states may pass the virus on to others. We assume that individuals in self-isolation or hospital-isolation cannot pass on the virus, but superspreading events are included to capture community, long-term care and nosocomial (hospital-acquired) clusters of transmission events. Note: ICU = intensive care unit.
Parameter values and their data sources are shown in Table 1. Appendix 1 details the biological, epidemiological and clinical severity parameters; internal validity checks (case fatality proportions and serial intervals); and epidemic constraints.
Transmission model parameters
Hospital-specific estimates
To generate each hospital’s catchment estimates over the anticipated months for the epidemic peak, we used ICES estimates on the median number (and interquartile range [IQR]) of hospital admissions and ICU admissions in the GTA and at each hospital from March to August 2019.11
For pre-outbreak inpatient bed use, Unity Health Toronto Decision Support provided daily census of non-ICU inpatients and ICU inpatients as a median (IQR) calculated over 90 days, using data from March to June of the years 2014 to 2019 (inclusive). It then provided inpatient census from Mar. 1, 2020, to May 6, 2020, for the comparison between the projected and actual census (Appendix 1).
Intervention parameters
We applied 2 GTA-wide interventions with assumptions surrounding their values: physical distancing to reduce contacts by 20% started 30 days into the outbreak, which was assumed to have seeded by Feb. 23, 2020, when at least 3 cases had been detected; and the proportion of nonsevere cases who self-isolated (default 10%, via testing or syndromic diagnoses). Intervention parameters were fixed for the primary analyses and varied in sensitivity analyses (0 to 70% reduction in contact rate; delay initiating physical distancing from 2 to 90 days after start of outbreak; increasing the proportion with nonsevere infection who self-isolate from 10% to a maximum proportion of individuals with COVID-19 who may develop symptoms [41%–69%]).47–49
Epidemic constraints
To generate a plausible range of epidemic trajectories under best- and worst-case scenarios, we sampled parameters as per Table 1 while fixing the intervention parameters. We used the following constraints: the upper and lower bound of the per-capita, cumulative cases detected per day in Lombardy, Italy,61 and Hong Kong, China,62 respectively, within the first 30 days after detection of 3 cases. We then selected a slow or small epidemic and a fast or large epidemic using the lower and upper IQR in the peak incidence across the full constrained set of epidemic trajectories. We defined a default scenario using the median or best-justified parameter values that passed our internal validity checks and epidemic constraints. We evaluated the face validity of our default epidemic by comparing it to our synthesis of the GTA data available as of Mar. 25, 2020, in which the first 3 cases had been detected by Feb. 23, 2020 (Appendix 1).12–17,63
Statistical analysis
We reported epidemic features and estimated health care needs across the range of plausible scenarios and the 3 selected scenarios for the GTA. We applied GTA model outputs from the 3 scenarios to generate hospital-specific estimates using the catchment proportion for non-ICU and ICU hospital admissions and added the baseline daily (median) number of inpatients on all non-ICU and ICU units for each hospital. We then compared the potential trajectories, under the assumption that baseline admissions remain the same, with the maximum capacity for non-ICU and ICU beds at each hospital. We performed a 1-way sensitivity analysis using the default scenario to identify the main sources of uncertainty when estimating hospital surge.
Ethics approval
This study was exempt from research ethics approval as the aggregate data provided by Unity Health Toronto Decision Support was not used to investigate a hypothesis systematically, and thus, it was not considered human research as defined in the Tri-Council Policy Statement: Ethical Conduct for Research Involving Humans (TCPS 2) by the Unity Health Toronto Research Ethics Board Chair who reviewed our application for waiver.
Results
Figure 2 depicts the per-capita cumulative rate of confirmed cases across the plausible range of epidemics in the first 60 days of the outbreak, in the absence of further intervention. The default scenario followed a similar early trajectory of rapid growth in observed cases in the GTA, although the fast or large and slow or small epidemics were closer to, but not at the level of Lombardy and Hong Kong, respectively (Figure 2).
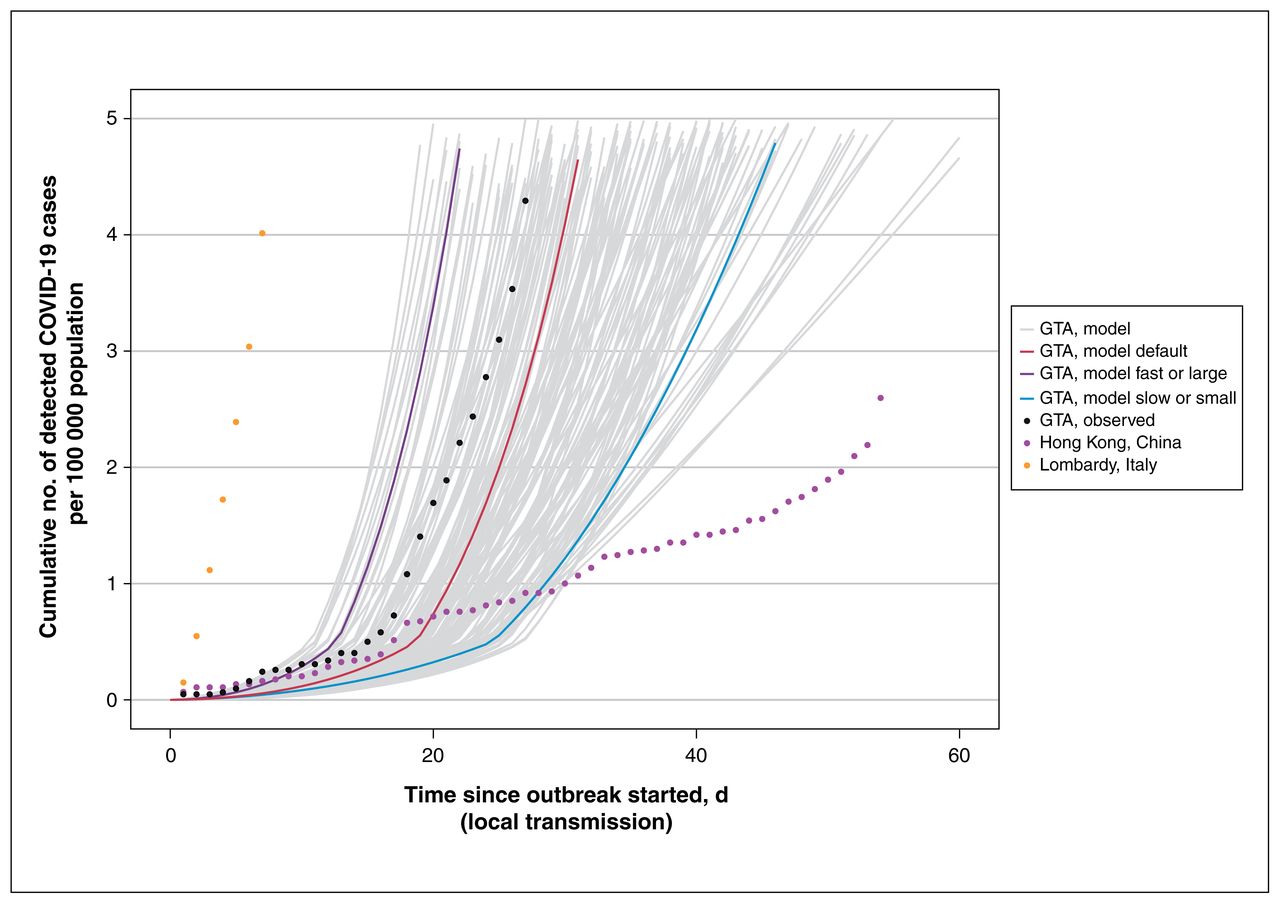
Cumulative detected cases per 100 000 population across simulated epidemic scenarios and observed data used for epidemic constraints. Model outputs from the sampled range of parameters in Table 1, which meet the model constraints are shown for detected cases as solid lines. The observed data for Lombardy, Italy,61 and Hong Kong, China,62 are shown as dotted lines, and the corresponding data points at day 30 since the outbreak started were used as upper and lower bounds, respectively, to constrain the epidemics. The observed data on cumulative detected cases for the GTA (travel-related and local transmission) up to Mar. 20, 2020, are also shown (dashed black line) as part of the face validity check. The model output for the fast or large epidemic is shown via the purple solid line and slow or small epidemic via the blue solid line, selected as the upper and lower quartile of peak incidence, respectively, within the first 300 days. The default (solid red line) depicts the default scenario (Table 1). Simulated timeline begins at the start of the “seeding” of the population with 0.0011%–0.0048% of the population already infected with severe acute respiratory syndrome coronavirus 2. For observed data, we defined the outbreak to have started when 3 confirmed cases were observed. We chose 3 cases detected as the onset of the epidemic based on the observed epidemic curve in the GTA, where the curve started to take off after detection of 3 cases (Feb. 23, 2020). We applied the same threshold for other regions for comparability of epidemic curves across geographic locations. Note: GTA = Greater Toronto Area, COVID-19 = coronavirus disease 2019.
Parameter values for the 3 scenarios are compared in Appendix 2, Supplemental Table 2.1, available at www.cmajopen.ca/content/8/3/E593/suppl/DC1. The slow or small epidemic had a smaller R0 of 1.84 versus 2.4 in the default scenario. Transmission-related parameters were similar in the fast or large and default scenarios, except for a slightly higher proportion of the population already infected with COVID-19 at the start of the outbreak (initial seeding, 0.004% v. 0.003% in the default scenario). However, cumulative confirmed cases (Figure 2; Appendix 2, Supplemental Figure 2.1) were much lower in the default scenario because of the clinical parameters: the proportion of individuals with COVID-19 with severe disease requiring admission to hospital and thus, detected, was 10.4% in the fast or large versus 5.5% in the default scenario.
Appendix 2, Supplemental Figure 2.2 shows the epidemic curves in the absence of further interventions, wherein the default represented a pessimistic scenario. Appendix 2, Supplemental Table 2.2 summarizes the peak number of admissions and peak in daily census of inpatients in the GTA.
Hospital-specific surge estimates
Between March and August 2019, St. Michael’s Hospital and St. Joseph’s Health Centre received 4.5% (95% confidence interval [CI] 4.4–4.6) and 3.9% (95% CI 3.8–4.0) of all non-ICU hospital admissions in the GTA, respectively, and 8.7% (95% CI 8.4–9.0) and 2.3% (95% CI 2.1–2.5) of ICU admissions in the GTA, respectively. In the years from 2014 to 2019, the median daily non-ICU and ICU inpatient census at St. Michael’s Hospital was 370–419 and 50–59, with a maximum capacity of 405 and 71 beds, respectively (Appendix 1). At St. Joseph’s Health Centre, the median daily non-ICU and ICU inpatient census was 353–390 and 17–23, with a maximum capacity of 407 and 32 beds, respectively (Appendix 1).
The scenario-projected daily census of non-ICU and ICU inpatients, with or without COVID-19, is shown for each hospital in Appendix 2, Supplemental Figures 2.3–2.6. The model estimated that if nothing changed with the baseline (pre-outbreak) levels of admissions, both hospitals would surpass non-ICU and ICU capacity under the fast or large and default scenarios by May 6, 2020, but (as expected based on Appendix 2, Supplemental Figure 2.2) that would not be the case with the small or slow epidemic (Appendix 2, Supplemental Figures 2.3–2.6). Driven by differences in their catchment areas, it was expected that St. Michael’s Hospital could have experienced an earlier surge around day 40 (May 27, 2020) and St. Joseph’s Health Centre, a later surge around day 65 (Apr. 21, 2020).
Table 2 provides the estimated daily census of inpatients with COVID-19 from each scenario, the median and IQR of the full range of constrained model outputs for the catchment area of each hospital and the relative reduction in non-COVID-19 admissions or absolute increase in ICU beds needed to address the surge at each site. For St. Michael’s Hospital to remain below its non-ICU bed capacity by May 6, 2020, the default scenario projected that a 38% reduction in non-ICU, non-COVID-19 care was needed to open up 150 non-ICU inpatient beds; St. Michael’s Hospital would also have to create 40 new ICU beds in addition to its current capacity of 71 beds to be able to care for non-COVID-19 and new COVID-19–related ICU inpatients (Table 2). At St. Joseph’s Health Centre, the default scenario projected a 28% reduction in non-ICU beds and 6% reduction in ICU-beds for non-COVID-19 care would be needed to open up 104 non-ICU beds and 1 ICU bed by May 6, 2020, and remain below the hospital’s respective bed capacity (Table 2).
Prevalent number of baseline* inpatients and inpatients with COVID-19 in non-ICU and ICU beds in 2 acute care hospitals in the Greater Toronto Area by May 6, 2020
Sensitivity analyses for hospital-specific surge estimates
Results of 1-way sensitivity analyses for projected inpatient census are shown using the default scenario for St. Michael’s Hospital in Appendix 2, Supplemental Figures 2.4–2.7. Results of sensitivity analyses were similar for St. Joseph’s Health Centre. Uncertainty in local epidemiological features (such as local seeding and interventions) was more influential than uncertainty in clinical severity. For example, if physical distancing could reduce contact rates by only 20%, then maximizing the diagnostic capacity or syndromic diagnosis at the community level in the GTA reduced the anticipated surge at St. Michael’s Hospital from 156 to 31 non-ICU patients with COVID-19 and 55 to 12 ICU patients with COVID-19 by May 6, 2020.
Comparison of projected versus observed hospital-specific surge
Figure 3 depicts the projected versus observed inpatient census for non-ICU and ICU patients with COVID-19 in each hospital. The default scenario anticipated the observed cases well in the short term (Mar. 25 to Apr. 11, 2020: absolute difference of < 20 cases across hospitals and units) but diverged considerably thereafter. Figure 4 depicts the projected versus observed versus inpatient census including patients with COVID-19. The actual reduction in beds was sufficiently large (Table 2) that each hospital remained within their bed capacity by May 6, 2020.

Estimated versus actual COVID-19 inpatient census at St. Michael’s Hospital (SMH) and St. Joseph’s Health Centre (SJHC) in the Greater Toronto Area. Model outputs from the default scenario. Observed data reflect the actual inpatient census of laboratory-confirmed cases of COVID-19. Results are shown for SMH (A) non-ICU inpatient census and (B) ICU census; and for SJHC (C) non-ICU inpatient census and (D) ICU census. The shaded area refers to the period of model projections used by each hospital in pandemic preparedness planning. Note: COVID-19 = coronavirus disease 2019, ICU = intensive care unit.

Estimated surge and capacity for non-ICU and ICU admissions to hospital at St. Michael’s Hospital (SMH) and St. Joseph’s Health Centre (SJHC) in the Greater Toronto Area. Model outputs from the default scenario under the assumption that pre-outbreak, non-COVID-19 admissions do not change. *Estimated by the median number of non-ICU inpatients at each hospital between March and June, 2014–2019. Observed data reflect the actual inpatient census up to May 6, 2020. Results are shown for SMH (A) non-ICU inpatient census and (B) ICU census; and for SJHC (C) non-ICU inpatient census and (D) ICU census. The dashed red line indicates the inpatient bed capacity. Note: COVID-19 = coronavirus disease 2019, ICU = intensive care unit.
Interpretation
Model projections of early COVID-19 spread anticipated a surge in admission to hospitals and ICU needs in the GTA. However, the impact of the city’s outbreak was expected to vary across hospitals by their local catchment area, with local epidemic features driving each hospital’s surge. The local transmission dynamics, or what was happening with the epidemic overall in the city with respect to community-level interventions, for example, had a larger influence on projected hospital surge than uncertainty around disease severity. Short-term projections closely matched that which transpired in each hospital, but there was wide divergence thereafter.
Our estimates of the GTA and hospital surge aligned with estimates from other modelling studies conducted around the same time (provincial and national64 in Canada, and in other settings65). The preliminary hospital-specific findings (on Mar. 4, 2020) were used to prepare for the local surge at the 2 hospitals, with the updated analyses from Mar. 25, 2020, used to continue planning efforts. The hospitals opened up beds by temporarily cancelling non-essential surgeries and procedures. As most COVID-19–related inpatient care would fall under the hospitalist and medicine services, the relevant departments rapidly set up a separate service with a viable back-up system and ability for rapid scale up. Ambulatory clinics were reduced with a focus on virtual care and urgent assessments; this allowed clinic space to be consolidated to preserve personal protective equipment and human resources for deployment to other areas. This consolidation also allowed identification of potential inpatient spaces. There was also a change in health care use by the public: non-COVID-19 medicine admissions are dropping across the city and country.66 The active and passive reductions in admissions meant that neither hospital went over capacity.
Limitations
Our 6-week scenario-based analyses were conditional on maintaining a status quo in interventions achieved as of Mar. 27, 2020. The divergence in modelled surge versus observed cases beyond the first 3 weeks of analyses likely reflect the impact of community-based interventions or influence of other heterogeneities that were not accounted for in our model. For example, as outbreaks in long-term care facilities were detected in late March and early April, 2020,67 some residents with severe infections were not transferred to acute care hospitals based on residents’ goals of care.68
We assumed that distribution of admissions would follow 2019 patterns and that transmission was homogenous across the city. However, distribution of admissions may be expected to follow even more granular patterns of transmission in each hospital’s neighbourhood-level catchment area.69 Future work includes capturing heterogeneity within the 5 health units and near real-time adjustment of the catchment area using observed patterns of hospital-specific admissions; and heterogeneity in contact patterns by age-group and across congregate settings. As interventions become dynamic over time, future analyses of surge would also benefit from consideration of duration of protective immunity.70 Since our model was deterministic, we did not capture random chance, which is especially important with small number of cases as would be expected at the hospital-level. Finally, our objective was to conduct a scenario-based analyses and not to fit the model explicitly to observed cases, admissions to hospital, ICU admissions and deaths in the GTA. Future work involves adapting and fitting to population and setting-specific data on trends in testing, cases and outcomes in the GTA.
Conclusion
A surge in hospital capacity in the GTA was expected across a range of pessimistic to optimistic scenarios during the COVID-19 pandemic, with important and practical variability anticipated at the hospital level. Although short-term estimates of the surge were reliable, medium-term estimates would benefit from re-analyses as community-level interventions remain a critical driver in mitigating hospital-level surge.
Acknowledgments
The authors thank the infection prevention and control practitioners and pandemic command centres at every health facility across the GTA who have come together as a working group, and whose efforts, solidarity and tireless work within each of their hospitals, guided the questions in this study. In particular, the authors thank the infection prevention and control teams and pandemic command centre at Unity Health Toronto for requesting and guiding the questions. The authors thank Jesse Knight for helpful feedback on the R Shiny tool. The authors thank Pavidra Ambiganithy, St. Michael’s Hospital Infection Prevention and Control Team, for supporting the coordination surrounding data requests. Sharmistha Mishra is supported by Tier 2 Canada Research Chair in Mathematical Modeling and Program Science. Sharon Straus is supported by a Tier 1 Research Chair in Knowledge Translation and Quality of Care.
Footnotes
Competing interests: Eric Coomes is the co–principal investigator on a randomized controlled trial of chemoprophylaxis for COVID-19. This trial is funded by the Toronto COVID-19 Action Initiative and Thistledown Foundation. No other competing interests were declared.
Contributors: Sharmistha Mishra, Linwei Wang, Huiting Ma and Matthew Muller conceived of and designed the study. Linwei Wang led model parameterization, justifications and internal validity checks. Huiting Ma led data analyses and figures. Linwei Wang led epidemic constraints and model analyses with Huiting Ma. Kristy Yiu led literature review with support from Eric Coomes. Kristy Yiu synthesized and collated all publicly available data for the GTA time series. All authors contributed to the acquisition and interpretation of data. Eliane Kim conducted the ICES analyses with J. Michael Paterson, Michael J. Schull and Lisa Ishiguro. Victoria Pequegnat and Anthea Lee conducted the Decision Support analyses. David Landsman developed the R Shiny tool. Sharmistha Mishra, Linwei Wang, Huiting Ma and Kristy Yiu drafted the manuscript; all authors contributed to revising the manuscript critically. All authors gave final approval to the version to be published and agreed to be held accountable for all aspects of the work.
Funding: The transmission modeling was supported by the Canadian Institutes of Health Research Foundation Grant (FN 13455), the Ontario Early Researcher Award (ER17-13-043) and the St. Michael’s Hospital Foundation Research Innovation Council’s 2020 COVID-19 Research Award. This study was supported by ICES, a non-profit research institute funded by the Ontario Ministry of Health and Long-Term Care.
Data sharing: Model code and data are available at https://github.com/mishra-lab/covid-GTA-surge-planning.
Supplemental information: For reviewer comments and the original submission of this manuscript, please see www.cmajopen.ca/content/8/3/E593/suppl/DC1.
Disclaimer: This study was supported by ICES, which is funded by an annual grant from the Ontario Ministry of Health and Long-Term Care (MOHLTC). The opinions, results and conclusions reported in this article are those of the authors and are independent from the funding sources. No endorsement by ICES or the Ontario MOHLTC is intended or should be inferred. Parts of this material are based on data and information compiled and provided by the Ontario Ministry of Health and the Canadian Institute for Health Information. The analyses, conclusions, opinions and statements expressed herein are those of the authors and not necessarily those of the funding or data sources; no endorsement is intended or should be inferred. The study was also supported by Unity Health Toronto Decision Support Analyses.
References
- Copyright 2020, Joule Inc. or its licensors
In this issue

Article tools


