

Abstract
Background: Alberta is considering capping daily fee-for-service physician billings, but little is known about high-volume practice in the province and its impact on patient health outcomes. In this initial study, we conducted a descriptive analysis of general practitioners’ patient volumes and billing practices in relation to associated practitioner demographic characteristics.
Methods: We conducted a retrospective descriptive analysis of the associations of practitioner characteristics, including full-time versus non–full-time practice, provider sex, years in practice, geographic location and international medical graduate status, with high-volume (> 50 visits/d) practice using general practice billing data from 2011 to 2016. Use of general practitioner service codes was described and compared by general practitioner volume status, with adjustment for physician demographic characteristics and geographic parameters.
Results: We included 3465 general practitioners practising fee-for-service in Alberta between 2011 and 2016, of whom 233 (6.7%) were identified as high-volume providers. Physicians who had been in practice longer (odds ratio [OR] 1.04 per year, 95% confidence interval [CI] 1.02–1.05) and international medical graduates (OR 1.89, 95% CI 1.40–2.54) were more likely to exceed 50 patient visits/day. Female physicians were less likely to exceed 50 patient visits/day (OR 0.14, 95% CI 0.07–0.28). Rural practice location was negatively associated with high-volume practice (OR 0.87, 95% CI 0.79–0.95) when we controlled for zone within the province. Zone 5 (North) was associated with high-volume practice (OR 1.95, 95% CI 1.06–3.58). Less than full-time practice was prevalent (1836 providers [53.0%]). High-volume general practitioners billed fewer service codes requiring longer visits, except for the most highly remunerated code (patients with complex health issues).
Interpretation: These results can inform policy-makers when considering payment system changes. Our next step is to examine the association of high-volume practice with outcomes important to patients, such as evidence of treatment failure (emergency department visits and hospital admissions) for conditions sensitive to primary care management.
In Alberta, several primary care reforms have been carried out in recent years. As part of this effort, primary care remuneration is currently under review as a part of primary care reform. Blended capitation is being piloted, and a daily billing cap is being considered. In British Columbia, a billing cap for more than 50 patients per day was introduced, but little is known about high-volume practice and its impact on patient outcomes. Economic theory suggests that, under a fee-for-service payment system that rewards shorter consultation times better, fee-responsive general practitioners see more patients and avoid longer consultations, potentially affecting the quality of care. However, in areas of physician undersupply, high-volume practice is required to meet health care demand.
Understanding the characteristics of high-volume general practitioners is important as we explore how volume of practice affects quality of care. Although quality of care is not easily measured, the quantity of health care services can be observed. However, the relation between visit volume and patient outcomes is unclear.1 The few Canadian studies on high-volume general practitioners have suggested that the number of patients seen does not always correlate with care quality.2,3 Management of specific chronic diseases may suffer among patients of higher-volume practices.4 Zyzanski and colleagues5 found that high-volume providers in the United States tended to be more “efficient,” as denoted by shorter appointment duration, but this came at the expense of preventive care services delivered, patient satisfaction and the physician–patient relationship. High-volume care is correlated with reduced continuity of care and population health outcomes.6 Understanding the characteristics of high-volume general practitioners will inform our future analysis of patient health outcomes in these practices. The objective of this study was to explore the relation among patient visit volume, physician characteristics and health service fee codes used.
Methods
Study cohort
All fee-for-service general practitioners in Alberta practising between 2011 and 2016 were included in the study.
Data sources
We obtained provincial administrative physician claims data from Alberta Health for all physicians billing fee-for-service under general practitioner service codes for the period Apr. 1, 2011, to Mar. 30, 2016. This data set has been shown to have value and face validity for health services research.7 The main service delivery site was identified for each general practitioner from the billing information.
We obtained a second data set containing general practitioner demographic characteristics including sex, years since medical school graduation and country of medical school origin from the College of Physicians and Surgeons of Alberta. This data set is a complete registry of all practising general practitioners in Alberta.
Variables
Average patient volume
Within a fixed period, there could be variations in the number of days a physician is practising. To account for this, we defined 90-day service periods for each physician included in the study. The first 90 service days for each physician, beginning Apr. 1, 2011, were considered in this analysis. We calculated the average daily patient volume over these 90 days using service claims for each general practitioner. We excluded physicians with an average of fewer than 10 or more than 100 claims per day, as we assumed that these physicians represented outliers. We included duplicate visits in the total average daily visit volume, as these typically represent repeat visits in the same day, i.e., genuine clinical activity.
Full-time status
General practitioners with evidence of billing for service provided on 90 calendar days within 6 months were considered full-time (1.0 full-time equivalent). It was assumed that a full-time doctor works 21–22 weekdays per month or 120–132 service days over the course of 6 months. Physicians who took more than 6 months to reach 90 days of service were considered non–full-time.
High-volume and non–high-volume physicians
We defined high-volume physicians as those with 50 or more visits billed per service day on average over the 90-day period. This is the threshold used for the daily cap adopted by British Columbia.8 All other physicians were considered non–high-volume.
Billing codes
We consulted an expert panel of general practitioners known to the research team involved in primary care leadership roles giving them a broad knowledge of the Alberta health care system. The panel identified a set of fee codes they believed to be used extensively by high-volume and rural physicians, along with commonly used time-sensitive codes. In Alberta, a time modifier can be added to the basic fee code to reflect the total time spent on a patient’s care. The 11 codes chosen for the study represented about 95% of the total number of claims submitted by general practitioners in Alberta in 2011 (Table 1). We hypothesized that there would be differences between high-volume and non–high-volume practitioners in the use of billing codes, particularly for care that requires longer visits.
General practitioner fee-for-service codes and percent use in Alberta in 2011
Geographic zones and rural–urban continuum
Alberta is divided into 5 zones (South, Calgary, Central, Edmonton and North) for health administration purposes and into the rural–urban continuum for planning and analytical purposes. The rural–urban continuum represents 7 designated population density ranges, from high (metropolitan centres) to low (rural remote), across the province.9 We considered both the zones and the rural–urban continuum in this analysis (Supplementary Table 1, Appendix 1, available at www.cmajopen.ca/content/6/3/E254/suppl/DC1).
Statistical analysis
Data tables from the administrative data set from Alberta Health as well as the demographic data from the College of Physicians and Surgeons of Alberta were imported into an SQL database (PostgreSQL 9.5, PostgreSQL Global Development Group). These data were linked by Alberta Health to the general practitioners contained in the claims data, anonymized and returned to us for analysis. The analysis was conducted with Stata 13 (StataCorp). The unit of analysis was the physician.
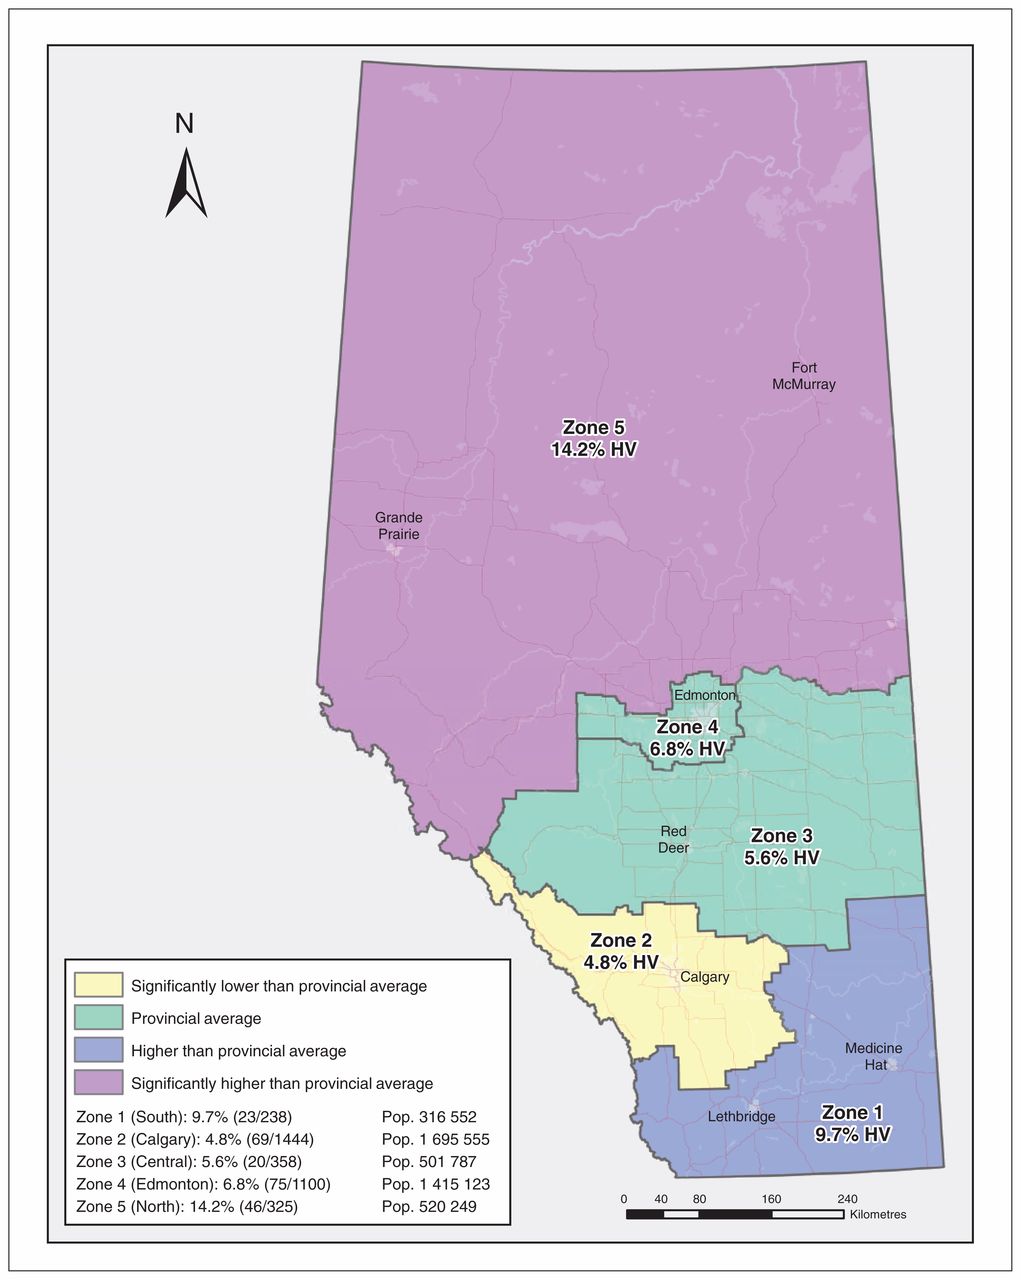
We created a map using Esri ArcGIS 10.5 to show the proportion of high-volume general practitioners in each zone. Using the map, we compared the proportion of high-volume practitioners in each zone to the provincial proportion of high-volume physicians using a standard score methodology (Figure 1).10 We used descriptive statistics to summarize demographic characteristics of high-volume and non–high-volume general practitioners by full-time status, average patient volume, years in practice, sex, geographic zone, the rural–urban continuum and distribution of fee codes used (Supplementary Table 2, Appendix 1).

Proportion of high-volume (HV) fee-for-service general practitioners in Alberta by zone compared to provincial average HV general practitioners. Note: Pop. = population.
Logistic regression of physician demographic characteristics associated with high-volume status*
We then used a logistic regression model to answer the main study question: What is the association between general practitioner high-volume status, demographic characteristics and billing use patterns? The independent variables included provider sex, full-time status, the interaction between those 2 variables, years in practice, country of medical school graduation (denoting international medical graduate), provider service geographic location (the 5 geographic zones) and an ordinal scale of rurality from 0 to 6 representing Alberta Health Services’ characterizations of practice sites. We described the 11 billing codes identified in Table 1 in univariate analyses and compared their use between high-volume and non–high-volume physicians using 2-sample t tests. Finally, we estimated a set of general linear models, 1 for each of the fee codes of interest, with the proportion of general practitioner visits that the code comprised as the dependent variable and high-volume status as a random effect, controlling for provider sex and years in practice, mean patient age, international medical graduate status, rurality and geographic zone. No adjustment was made for the 11 tests, as the large sample size made any significant result so highly significant that adjustment was superfluous.
Sensitivity analysis
We conducted a second logistic regression using a second 90-day service period for each physician, beginning Apr. 1, 2013, to ensure that the findings were not sensitive to the time period examined. We also used 2 alternative definitions of high volume (> 60 patients/d and > 70 patients/d) in further sensitivity analyses.
Ethics approval
Ethics approval was obtained from the University of Alberta Health Research Ethics Board and the Conjoint Health Research Ethics Board of the University of Calgary.
Results
A total of 3465 general practitioners practising in Alberta between 2011 and 2016 were identified. There were slightly more male practitioners (2012 [58.1%]) than female practitioners (1444 [41.7%]). Most worked in the 2 main metropolitan centres (Edmonton and Calgary). About 80% (2761) were urban or metropolitan providers, and 20% (704) were rural providers. Of the 3465, 1629 (47.0%) worked full-time, and 1836 (53.0%) were non–full-time.
We identified 233 high-volume general practitioners (6.7%), of whom 158 (67.8%) were full-time providers and 75 (32.2%) were non–full-time providers. The average number of years in practice was 28.5 and 27.6, respectively. Figure 1 provides an overview of the distribution of these physicians by zone. Zone 5 (North) contained a significantly higher proportion of high-volume physicians (14.2%, 95% confidence interval [CI] 10.36%–17.94%) than the provincial average (6.7%, 95% CI 5.89%–7.56%), whereas zone 2 (Calgary) contained a significantly lower proportion (4.8%, 95% CI 3.68%–5.88%). Of the 3232 non–high-volume general practitioners, 1471 (45.4%) were full-time providers and 1761 (54.5%) were non–full-time providers; the average number of years in practice was 22.3 and 21.2, respectively.
Billing patterns
Billing patterns using the 11 identified fee codes differed across non–high-volume and high-volume general practitioners (Supplementary Table 2, Appendix 1). Limited assessment/less time intensive billing codes were more prevalent among high-volume providers than among non–high-volume providers, except for the complex care code. Conversely, comprehensive assessments and time-intensive codes such as mental health, after-hours care and the time modifiers were used less for high-volume providers than for non–high-volume providers.
Association between high-volume status, demographic characteristics and billing patterns
Results of the logistic model are presented in Table 2. Years in practice and male sex were both positively associated with being a high-volume general practitioner, but full-time status was not significantly associated with high-volume status after adjustment for other characteristics. However, the interaction term between provider sex and full-time status was significant, with an odds ratio for high-volume practice for full-time versus of 4.6 (95% CI 2.02–10.56) compared to non–full-time female providers. For women but not for men, non–full-time status was strongly negatively associated with high-volume status.
When other demographic factors were controlled for, greater rurality was associated with lower likelihood of being high-volume. Administrative zone of practice was also a significant predictor of high-volume practice, with physicians in zone 5 (North) more likely to be high-volume than those in any other zone. Other zones did not differ significantly from one another.
After adjustment for other demographic factors, high-volume physicians avoided fee codes that are time intensive, at the 5% level of significance (Supplementary Table 2, Appendix 1). These included comprehensive assessment, time-modifier codes and after-hours care (Table 3).
Results of general linear regression models for each general practitioner billing code
Sensitivity analyses
When we repeated the logistic regression using the second 90-service day period, no significant differences were found. The regression was also repeated with 60 and 70 visits/day as the definition of high volume. The only difference found was that, at 70 visits/day, the effect interaction between provider sex and full-time status could not be tested, as there were no female physicians practising at that volume.
Interpretation
We found that a small proportion (7%) of general practitioners in Alberta would be considered high-volume providers with the definition of 50 or more patient visits per day. There were significant differences in demographic characteristics between high-volume and non–high-volume practitioners. In particular, high-volume physicians typically had more years in practice and were more likely to be male, to work full-time, to live in northern Alberta and to be an international medical graduate. Billing patterns differed in the expected directions for high-volume compared to non–high-volume providers.
Chan and colleagues2 in 1998 examined billing patterns of general practitioners with an annual billing total of $400 000 or more. These high-billing providers were more likely to be male and international medical graduates and to live in areas of low physician supply. We similarly found male physicians, international medical graduates and those in the area of lowest supply (zone 5) to be more likely to be high-volume providers. In previous years, international medical graduates were recruited to remote areas in Alberta, but, in the current study, international medical graduates were more likely to be high-volume providers regardless of location.11,12
A slight majority (53%) of general practitioners in Alberta practised non–full-time. This finding is mirrored in other work; in general, there has been a decrease in the total number of hours physicians’ services are being offered over the past few decades.13 A cohort analysis of general practitioners for the period 1982–2003 indicated a 16% reduction in direct patient hours provided per week.14 The investigators specifically noted the effect in male general practitioners regardless of their age.14 We found that non–full-time practice was common in Alberta, even among high-volume providers, although high-volume practice by part-time female general practitioners was uncommon.
The average years of practice for the non–high-volume cohort and the high-volume cohort was 22 years and 28 years, respectively. Other investigators have found that general practitioners tend to work more in the early part of their careers than the later part,15 although this finding appears to vary depending on the cohort examined.16,17 It is possible that our results diverge in Alberta because we have observed an effect of a specific cohort, a group comprising older, more experienced and more efficient general practitioners. Economic factors such as the 2008 recession may have influenced time to retirement for general practitioners longer in practice.
Rurality was not found to be associated with high-volume practice in the present study. Rural physicians’ workloads tend to differ from those of their urban colleagues and involve a broader scope of practice and longer work hours, but that may not necessarily translate into a higher volume of patients.18–20 There was, however, a specific geographic effect of zone 5 (northern Alberta).21 This area comprises 448 500 km2, is supplied by 325 general practitioners and has a population of about 480 000.22 It is possible that general practitioners working in this part of the province have higher-volume practices out of necessity, owing to the lower physician-to-population ratio. Conversely, the northern zone may simply disproportionately attract high-volume general practitioners because it provides more opportunity for their preferred scope and practice style.
A key finding of this study is that high-volume general practitioners tended to bill fewer service codes that required longer visit times, which would negatively affect their overall patient volume. This is consistent with the behavioural effects expected of a fee-for-service system.23 The exception was the use of the complex care fee code (03.04J) by high-volume providers. This code is intended to support an annual care plan for patients with complex health issues. It pays a fee 5 times that of a “regular” visit, which makes it a lucrative billing code, but is not a time-based code and can be delegated to other providers in the clinic (Appendix 1). Similarly, the use of time-modifier codes (denoting additional time spent with patients) was negatively associated with high-volume practice, in keeping with our hypothesis.
Limitations
Our findings should be interpreted in light of the following limitations. First, we were not able to examine details of practice structure including number of physicians and patient panel size, nor we were able to explore elements of the “medical home” model such as size of collaborative team, hours of operation and provision of after-hours care.24 Second, we did not attempt to account for the medical complexity of patients’ conditions or other patient characteristics such as age, sex or socioeconomic status, a known shortcoming of this type of analysis.25 Third, as physician claims are not associated with time of day, it is not possible to determine over how many hours patients are seen. We are reasonably confident that high-volume general practitioners spent less time with each patient given their less frequent use of time-intensive billing codes, but there may be exceptions to this. Finally, our definition of full-time differed from the Canadian Institute for Health Information’s measure based on dollars billed,26 because a high-volume non–full-time general practitioner could easily bill enough to be misclassified as full-time by that method.
Conclusion
The findings of this study, based on a large provincial cohort of general practitioners, shed light on the billing patterns and demographic characteristics of high-volume general practitioners in the Canadian context. Many questions remain in regard to their practice patterns, demographic characteristics and the type of patients they serve. Physician resource planners, training residents and general practitioners alike will also be interested in the number of general practitioners who are not working full-time based on our definition. Our next step is to examine the association of high-volume practice with outcomes important to patients, such as emergency department visits and hospital admissions for conditions sensitive to primary care management.
Acknowledgements
The authors acknowledge Alistair J. McGuire, Department of Social Policy, Chair of Health Economics, London School of Economics and Political Science for his support in developing and refining the early aspects of this project’s methodology and Tanya Barber, research coordinator, Enhancing Alberta Primary Care Research Networks (EnACt), University of Alberta, who generously provided ongoing administrative research support.
Footnotes
Competing interests: None declared.
This article has been peer reviewed.
Contributors: Lee Green, Haifeng Zhu and Terrence McDonald analyzed the data. All of the authors contributed to the concept and design of the work, interpretation of data, and drafting the manuscript and revising it critically for important intellectual content, gave final approval of the version to be published and agreed to be accountable for all aspects of the work.
Funding: A small grant was accepted from the University of Alberta Northern Academic Family Research Fund for the purpose of purchasing the data used in this analysis.
Disclaimer: This study is based in part on data provided by Alberta Health. The interpretation and conclusions contained herein are those of the researchers and do not necessarily represent the views of the government of Alberta. Neither the government of Alberta nor Alberta Health expresses any opinion in relation to this study.
Supplemental information: For reviewer comments and the original submission of this manuscript, please see www.cmajopen.ca/content/6/3/E254/suppl/DC1.
References
- Copyright 2018, Joule Inc. or its licensors