


Abstract
Background: COVID-19 imposed substantial health and economic burdens. Comprehensive population-based estimates of health care costs for COVID-19 are essential for planning and policy evaluation. We estimated publicly funded health care costs in 2 Canadian provinces during the pandemic’s first wave.
Methods: In this historical cohort study, we linked patients with their first positive SARS-CoV-2 test result by June 30, 2020, in 2 Canadian provinces (British Columbia and Ontario) to health care administrative databases and matched to negative or untested controls. We stratified patients by highest level of initial care: community, long-term care, hospital (without admission to the intensive care unit [ICU]) and ICU. Mean publicly funded health care costs for patients and controls, mean net (attributable to COVID-19) costs and total costs were estimated from 30 days before to 120 days after the index date, or to July 31, 2020, in 30-day periods for patients still being followed by the start of each period.
Results: We identified 2465 matched people with a positive test result for SARS-CoV-2 in BC and 28 893 in Ontario. Mean age was 53.4 (standard deviation [SD] 21.8) years (BC) and 53.7 (SD 22.7) years (Ontario); 55.7% (BC) and 56.1% (Ontario) were female. Net costs in the first 30 days after the index date were $22 010 (95% confidence interval [CI] 19 512 to 24 509) and $15 750 (95% CI 15 354 to 16 147) for patients admitted to hospital, and $65 828 (95% CI 58 535 to 73 122) and $56 088 (95% CI 53 721 to 58 455) for ICU patients in BC and Ontario, respectively. In the community and long-term care settings, net costs were near 0. Total costs for all people, from 30 days before to 30 days after the index date, were $22 128 330 (BC) and $175 778 210 (Ontario).
Interpretation: During the first wave, we found that mean costs attributable to COVID-19 were highest for patients with ICU admission and higher in BC than Ontario. Reducing the number of people who acquire COVID-19 and severity of illness are required to mitigate the economic impact of COVID-19.
The COVID-19 pandemic continues to have unprecedented effects on social and health care systems.1–5 COVID-19 has been identified as a substantial driver of increasing health care expenditures in Canada.6 The total cost of hospital admissions related to COVID-19 was estimated at more than $317 million from January to November 2020 in Canada (excluding Quebec), with $40 million in British Columbia and $202 million in Ontario.7 The average cost per hospital stay with and without intensive care unit (ICU) admission was $47 000 and $14 000 in BC, and $49 000 and $15 000 in Ontario,7 respectively, substantially exceeding the cost of a standard hospital stay in 2018 ($6464 in BC and $5484 in Ontario).8 However, costs of health care services related to COVID-19 outside hospitals are unknown.
Understanding the system-wide costs of health care services during the first wave for people with COVID-19, including those who did not require hospital admission, is essential for economic evaluations of management strategies for COVID-19. Such evidence is crucial to measure the economic burden of COVID-19 illness and inform evidence-based health care planning and decision-making that control the spread and severity of COVID-19. Our objective was to address this gap by estimating the direct medical costs for patients with COVID-19, stratified by the highest level of initial care, in BC and Ontario during the first wave of the pandemic from January to July 2020.
Methods
Study design and setting
We conducted a historical cohort study with matched comparators in 2 Canadian provinces (BC and Ontario).9 With populations of 14.5 million (Ontario) and 5.2 million (BC), these provinces include more than half of the Canadian population. We conducted the analysis from the health system perspective using linked administrative data and SARS-CoV-2 testing data. British Columbia and Ontario have similar population-based administrative data holdings.10 We used the Reporting of studies conducted using observational routinely-collected health data (RECORD) checklist to report our study.11
Study population
We identified people who tested positive for SARS-CoV-2 up to June 30, 2020, from the BC Ministry of Health COVID-19 Test Laboratory Data12,13 and the Ontario Laboratory Information System (OLIS) COVID-19 databases.14 We set the index date as the specimen collection date of the first reported positive test result. Testing criteria evolved during the first wave. In BC, testing was initially limited to patients with severe disease, patients requiring hospital admission, patients in long-term care or health care workers. Testing was later expanded to include those with other symptoms.15,16 In Ontario, testing was initially limited to people with respiratory symptoms, and later expanded to those with nonrespiratory symptoms.17
We excluded patients who had an invalid or missing provincial health insurance number (BC Medical Services Plan [MSP]18 or Ontario Health Insurance Plan [OHIP]19), did not reside in the province of diagnosis at index date or had incomplete provincial health insurance coverage for 1 year before the index date.
Data sources
We used individual-level population-based provincial records of health care services and demographics (Appendix 1, Table S1, available at www.cmajopen.ca/content/10/3/E818/suppl/DC1). In both provinces, the databases included records of inpatient hospital admissions, emergency department visits, same-day surgeries, physician services, outpatient prescription drugs, home care and long-term care. In Ontario, visits to cancer clinics, dialysis clinics and other ambulatory clinics were also captured in the data. In BC, data linked using unique encoded patient identifiers were provided through Population Data BC13,18,20–23 and analyzed by the BC research team. In Ontario, these data sets were linked using unique encoded identifiers and analyzed at ICES.24 ICES is an independent, nonprofit research institute whose legal status under Ontario’s health information privacy law allows it to collect and analyze health care and demographic data, without consent, for health system evaluation and improvement. In both provinces, linkage was 100% for people covered by the provincial health insurance plans. A small proportion of tests (2% in BC, 0.2% in Ontario) could not be linked to administrative data (Appendix 2, Figure S1, available at www.cmajopen.ca/content/10/3/E818/suppl/DC1).
Outcomes and variables
Health care costs vary by the setting where care is delivered. To characterize this heterogeneity, we stratified people with COVID-19 by the highest level of care received during the first 14 days after the index date25 by admission to hospital with days in the ICU; admission to hospital without ICU days; long-term care (LTC) facilities; and community (Appendix 2a). We adapted the Public Health Ontario classification of COVID-19 severity, based on admission to hospital or ICU,25 and included categories for patients managed in LTC facilities or the community to account for different patterns of care.26,27
We greedy-matched each patient with COVID-19 in BC and Ontario28 to as many as 4 controls from the general population who were registered for MSP or OHIP, respectively, and did not have a positive test result for SARS-CoV-2 up to June 30, 2020. The matching strategy (Appendix 2b) included age, sex, residence in LTC (Appendix 2c) and a propensity score containing comorbidity (Johns Hopkins Adjusted Clinical Groups [ACG] System version 10, Aggregated Diagnosis Groups [ADGs] and Resource Utilization Band)29 (Appendix 2d), and geographic and socioeconomic factors (Appendix 2e). We also computed an ADG score for each person, which assigned positive or negative weights to the ADGs depending on the size and direction of their association with the probability of 1-year mortality.29
We observed patients and controls for as many as 120 days after the index date. We censored people at the end of the observation period, July 31, 2020, or the end of their MSP or OHIP registration. For patients with COVID-19 who died, their matched controls were censored at the patient’s date of death. If a control died, we reweighted the remaining controls in the matched set to maintain the matching ratio.
Statistical analysis
We used standard established methods for estimating direct medical costs from administrative data in BC and Ontario.30 Resources included hospital admissions, emergency department visits, physician services, outpatient prescription drugs and others (Appendix 2f).
We calculated mean and median costs for patients and controls in each 30-day period from 30 days before to 120 days after the index date. We included a preindex period to capture health care for symptoms before SARS-CoV-2 testing, including hospital admissions and physician visits. We included people still being followed (i.e., alive and uncensored) at the start of each 30-day period in the cost estimate until the end of that period, with no adjustment for the number of days of observation within each period.
We estimated net costs (mean difference between the cost for a patient with COVID-19 and their matched controls)31–34 and 95% confidence intervals (CIs) using generalized estimating equations, with a γ distribution, identity link and exchangeable correlation structure to account for matched clusters. We stratified net costs in the first 30 days after the index date by level of care, age, sex and comorbidity.
We estimated net cumulative costs by 30-day period from the preindex period to 120 days after the index date. We accumulated costs for each person up to the end of the 30-day period in which the person died or was censored but not beyond.
We calculated total cohort-level costs (in 2020 Canadian dollars) for initial care by summing the costs of all people with COVID-19 for the 30 days before the index date and first 30 days after the index date.
Ethics approval
This study was approved by The University of British Columbia/BC Cancer Research Ethics Board and the University Health Network Research Ethics Board (Toronto).
Results
After applying exclusion criteria, we included 2465 people in BC and 28 893 in Ontario (Appendix 2, Figure S1). Their mean ages were 53.4 (standard deviation [SD] 21.8) years (BC) and 53.7 (SD 22.7) years (Ontario), and 56% of both cohorts were female. In both provinces, more than 95% of the people lived in urban areas. In BC and Ontario, respectively, 44.8% and 50.8% of the people lived in neighbourhoods in the 2 lowest income quintiles (Table 1; Table 2).35 On their index date, 288 people (11.7%) in BC and 5152 (17.8%) in Ontario were living in LTC facilities (Appendix 2, Figure S2).
Demographic and clinical characteristics of people with COVID-19 and matched controls in British Columbia at the index date, by highest level of care
Demographic and clinical characteristics of people with COVID-19 and matched controls in Ontario at the index date, by highest level of care
We matched people with COVID-19 with 1 (0.2%) to 4 controls (98.7%) in both provinces. Balance was achieved in all covariates, with standardized differences of less than 0.10 (Table 1; Table 2).36
Within the first 14 days of their positive SARS-CoV-2 test, 13.2% and 10.1% of people were admitted to hospital without ICU days, and 5.6% and 3.3% were admitted to hospital with ICU days (Table 1; Table 2; Appendix 2, Table S1), in BC and Ontario, respectively. Most of the patients admitted to hospital and the ICU were male. Among residents of LTC at the index date, 86% to 87% remained in LTC after a positive SARS-CoV-2 test result. In BC, 14% of LTC residents were admitted to hospital (2% with ICU), and in Ontario, 13% were admitted to hospital (1.4% with ICU) (Appendix 2, Figure S2). In the LTC groups, more than 66% of patients were female, with older mean ages and higher mean ADG comorbidity scores29 than patients in the other groups (Table 1; Table 2).
We found that mean follow-up time was 99.5 (SD 38.0) and 83.1 (SD 33.5) days in BC and Ontario, respectively. Death mostly occurred in the first 30 days after the index date (Appendix 2, Table S2). Few people with COVID-19 (< 6) in Ontario and none in BC were censored within the first 30 days after the index date. In later months, censoring ranged from 4.2% to 42.1% and 5.3% to 92.9% in BC and Ontario, respectively, with most censoring occurring between 91 and 120 days (Appendix 2, Figure S3).
During the preindex period, we determined that the mean costs for all people with a positive test result in BC and Ontario, respectively, were $1465 and $1593, ranging from $302 and $260 for those in the community group to $4494 and $5391 for those in the hospital group (Table 3; Table 4; Appendix 2, Table S3). In BC, 62.6% of the people in the hospital group and 67.6% of those in the ICU group were in hospital on their index date, compared with 21.2% and 11.4% in Ontario.
Mean cost per person with COVID-19 by resource for 30 days before and the first 30 days after the index date in British Columbia, by highest level of care
Mean cost per person with COVID-19 by resource for 30 days before and the first 30 days after the index date in Ontario, by highest level of care
In the 30 days after index date, the mean cost per person with a positive test result for SARS-CoV-2 was $7512 in BC and $4491 in Ontario. Costs increased to $66 324 and $56 716 for the ICU groups and $23 015 and $17 050 in the hospital groups in BC and Ontario, respectively (Table 3; Table 4; Appendix 2, Table S3). In the first month after the index date, costs for hospital admissions represented about 80%–90% of total costs for patients in the ICU and hospital. In the community group, physician services and emergency department visits were the costliest resources after the index date (Table 3, Table 4).
During the preindex period, we found that mean net costs in BC and Ontario, respectively, were $3133 and $3628 for people in the hospital group, and $966 and $2493 for those in the ICU group (Table 5). In the first 30 days after the index date, net costs were highest for the ICU groups, at $65 828 and $56 088 in BC and Ontario, respectively, and lowest for the community groups ($117 and $161, respectively; Table 5).
Mean net cost per person with COVID-19 in British Columbia and Ontario for each 30-day period before and after the index date, by highest level of care
We also found that the net costs for the LTC group in BC were negative before the index date (−$397) and positive for the next 90 days before becoming negative (Table 5). In Ontario, net costs were −$748 before the index date and higher in the first 30 days after the index date (−$327).
We determined that mean net cumulative costs for people with COVID-19 from 30 days before to 120 days after the index date were, in BC and Ontario, respectively, $90 056 and $96 308 (ICU group), $33 640 and $28 329 (hospital group), −$46 and −$1105 (LTC group), and $96 and $487 (community group) (Figure 1; Appendix 2, Table S4).
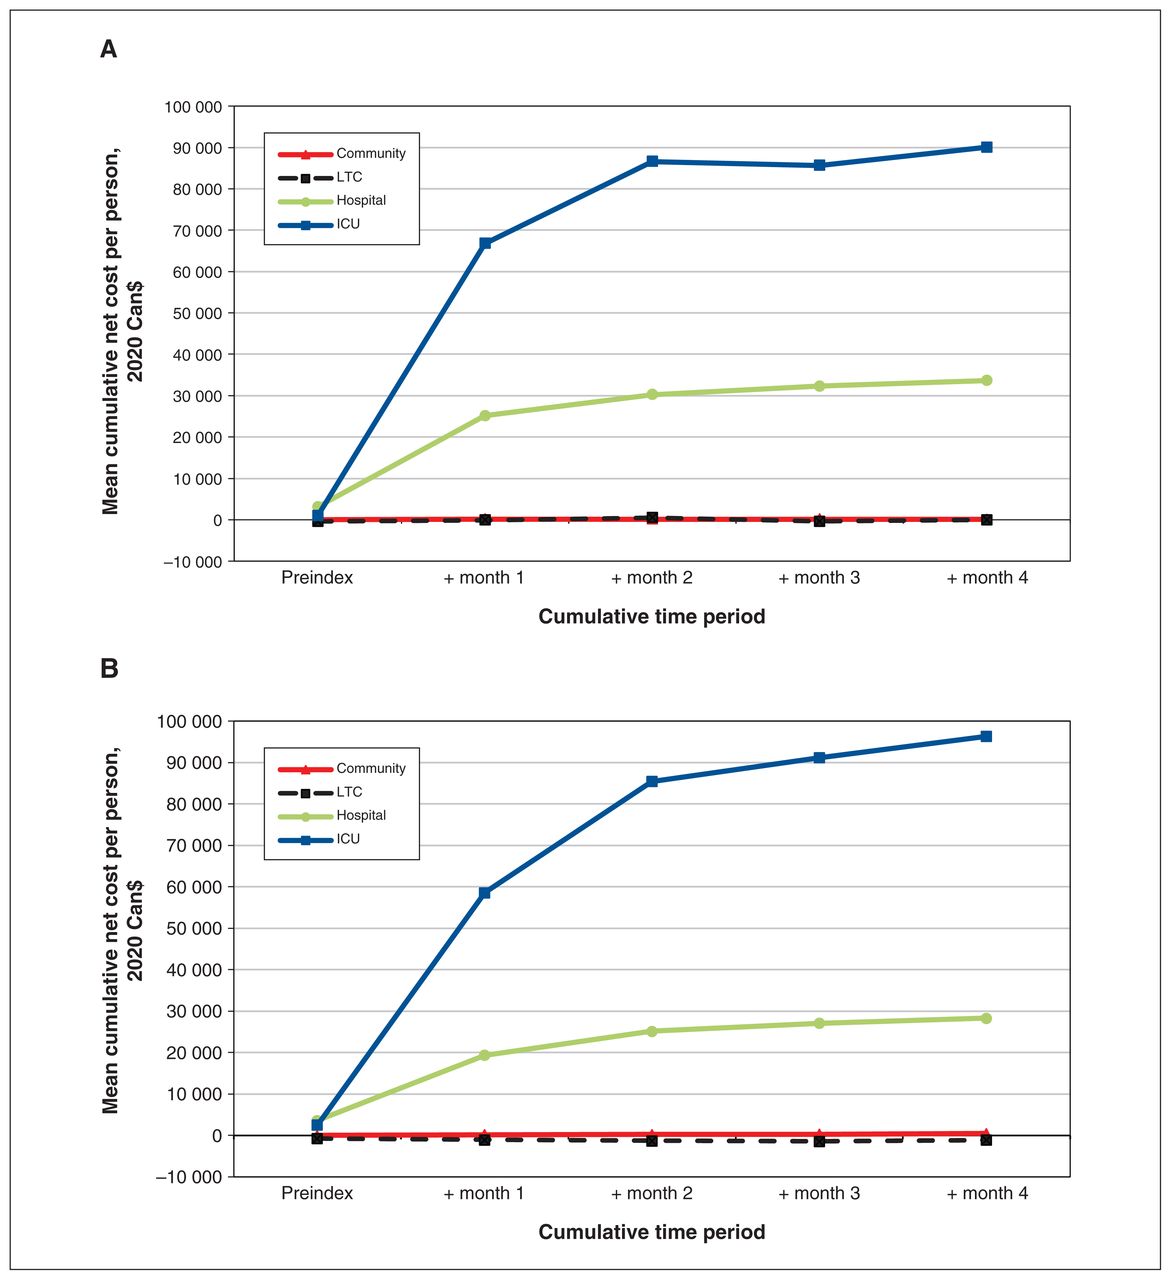
Mean cumulative net costs per person from 30 days before to 120 days after the index date for those with a positive SARS-CoV-2 test result, by highest level of care, in (A) British Columbia and (B) Ontario. Note: ICU = intensive care unit, LTC = long-term care.
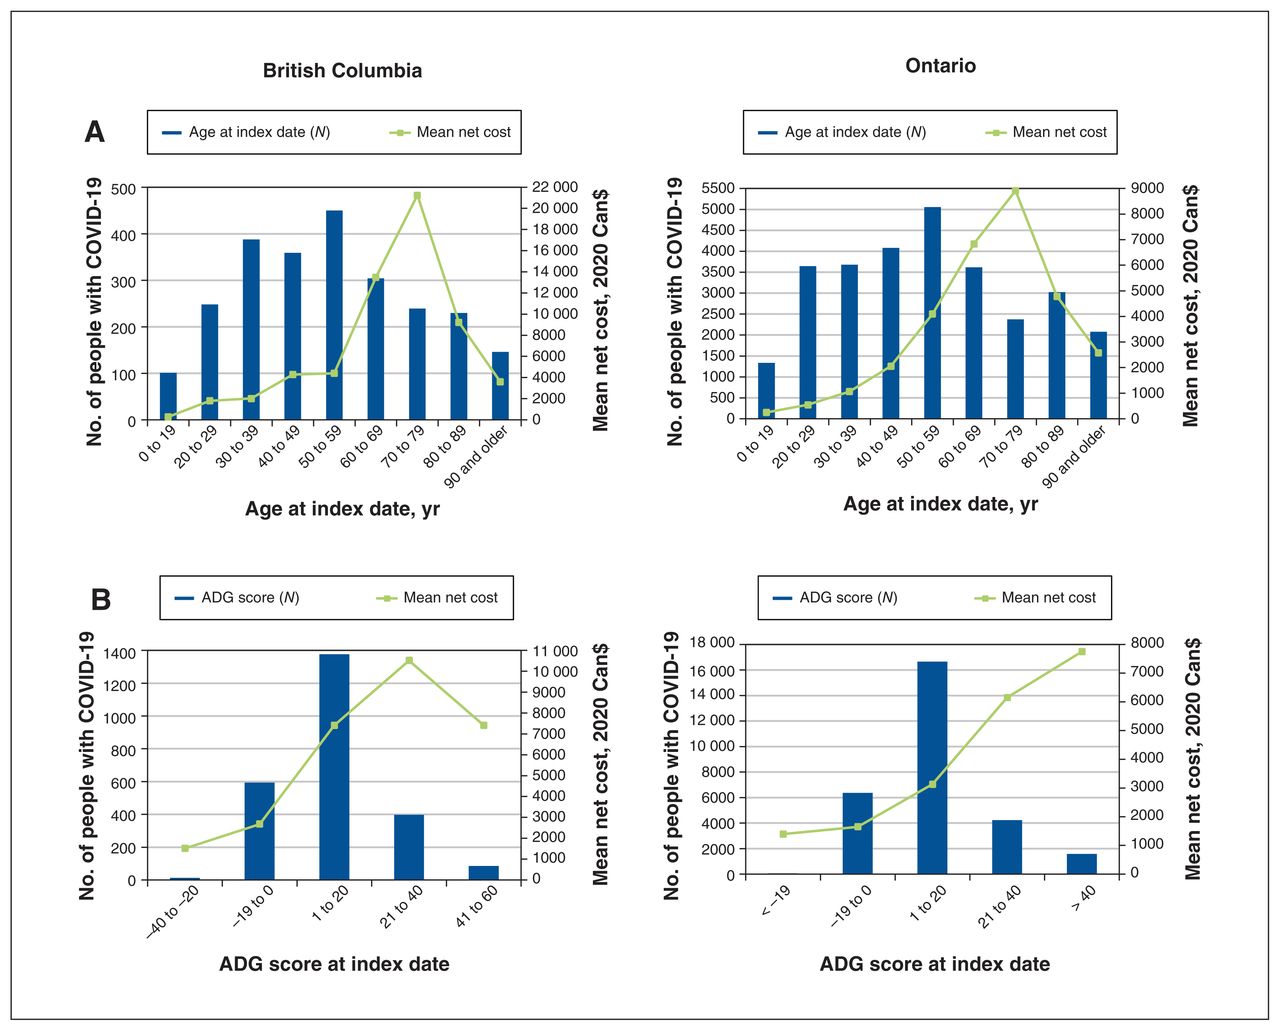
We found that mean net costs in the first 30 days after the index date increased with age up to 70–79 years and then decreased (Figure 2A). Mean net costs ranged from $287 for patients aged 19 years and younger to $21 250 for those aged 70–79 years in BC, and from $248 for patients aged 19 years and younger to $8914 for those aged 70–79 years in Ontario (Appendix 2, Table S5).

(A) Mean net costs in the first 30 days after the index date and the number of people with COVID-19, by age at index date, in British Columbia and Ontario. (B) Mean net costs in the first 30 days after the index date and number of people with COVID-19, by John Hopkins ADG score, in British Columbia and Ontario. Note: ADG = Aggregated Diagnosis Groups.
Mean net costs for males were almost twice those for females ($9939 v. $4613 in BC and $4752 v. $2520 in Ontario) (Appendix 2, Table S5). We found that comorbidity greatly increased net costs, with a downturn in BC for the highest comorbidity level (Figure 2B; Appendix 2, Table S5). Mean net costs for people who resided in LTC facilities at the index date were lower than those who resided in the community (BC, $2964 v. $7239; Ontario, $1916 v. $3802).
Figure 3 shows the total costs for all people in each level of care group and their matched controls. We found that the total health care costs from 30 days before to 30 days after the index date across all levels of care were $22 128 330 in BC and $175 778 210 in Ontario, for 2465 and 28 893 people, respectively, who had a diagnosis of COVID-19 from January to June 30, 2020. Total net costs attributable to COVID-19 were $17 651 803 in BC and $111 204 497 in Ontario.
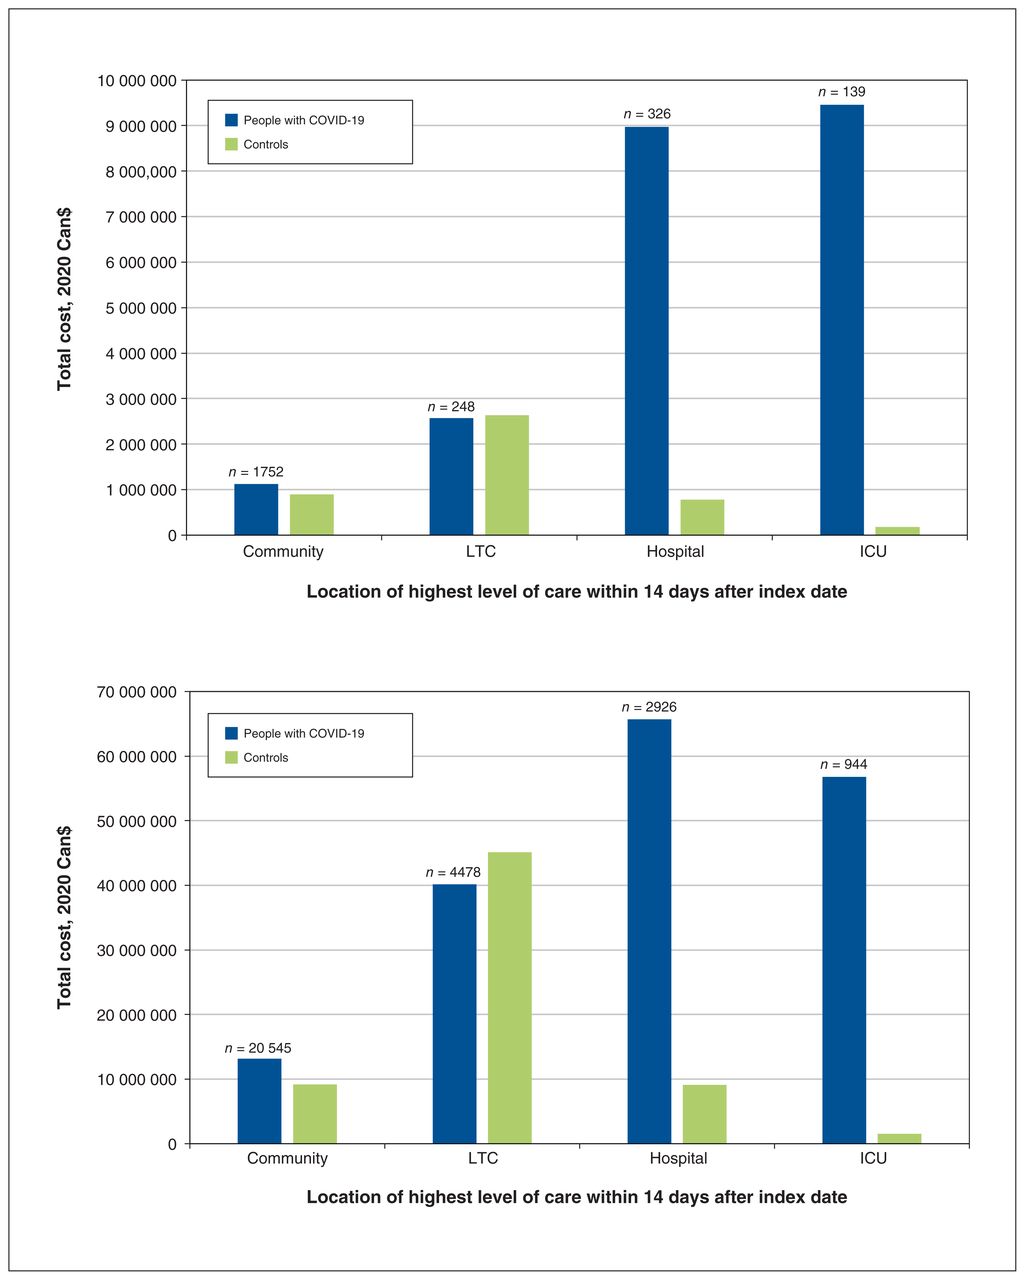
Total costs for initial care (before the index date and month 1) for all people with COVID-19 and controls, by highest level of care, in (A) British Columbia (n = 2465) and (B) Ontario (n = 28 893). Note: ICU = intensive care unit, LTC = long-term care.
Interpretation
We found that costs attributable to COVID-19 during the first wave varied by health care setting and remained substantive up to 120 days after the index date for patients initially treated in the hospital or ICU. The total health care costs were much higher in Ontario than BC because of a higher caseload, whereas mean costs per COVID-19 case were higher in BC because of differences in the setting of care and higher unit costs of hospital admission.
We determined that total costs to the health care system depended on the number of patients and mean cost per patient. As of June 30, 2020, about 0.27% of the Canadian population had SARS-CoV-2 infection.37 People with COVID-19 in our study represented about 0.05% and 0.2% of the BC and Ontario populations, respectively, over the same period.9 British Columbia was initially more effective than Ontario at flattening the pandemic curve, with earlier public health restrictions26 and better management to contain the spread of infection in LTC facilities.27
We determined that Ontario’s caseload contributed to a higher health system cost during the first wave compared with BC. The aggregate cost for initial care (30 d before and 30 d after the index date) for all people with COVID-19 who were diagnosed from January to June 30, 2020, was $22 128 330 in BC and $175 778 210 in Ontario. These amounts were about 0.10% and 0.27% of the respective provincial annual 2020 budgets for health care.38,39
COVID-19 and influenza have similar symptoms;40 however, patients admitted to hospital for COVID-19 are more likely to acquire acute respiratory failure, be admitted to the ICU and die in hospital.41,42 In 2018, 1429 patients were admitted to hospital for influenza in BC and 4320 in Ontario. The mean costs per hospital admission for influenza were $4572 (BC) and $3613 (Ontario),43 which resulted in budget impacts of $6.5 million in BC and $15.6 million in Ontario. In addition, 541 patients were admitted to hospital with respiratory failure in BC and 2743 in Ontario. At average costs of hospital admission of $30 113 (BC) and $26 746 (Ontario) for respiratory failure, the total cost for hospital admission was $16.3 million in BC and $73.4 million in Ontario.43 Costs for hospital admission for COVID-19 per patient were higher than for influenza and similar to respiratory failure. Furthermore, in Ontario, the higher case numbers of COVID-19 led to higher total costs over the first 6 months of 2020 than the total hospital admission costs of influenza and respiratory failure for all of 2018.
We determined that the mean costs per patient in the first 30 days after the index date for the hospital and ICU groups were higher in BC than in Ontario, driven by higher hospital admission costs. The mean costs for hospital admission in Ontario were comparable to the estimated mean costs of a hospital stay related to COVID-19 provided by the Canadian Institute for Health Information (CIHI)7 and those from a retrospective study that involved beneficiaries of Medicare in the United States;44 however, costs for hospital admission in BC were higher. In recent years, BC’s hospital costs have been higher than the national average,8 with the highest-ranked quality of health care in Canada.45 In contrast, Ontario has the lowest cost per standard hospital stay of all provinces and territories.8 Costs of a standard hospital stay after COVID-19 have not been reported by CIHI.
During the period of our study, more female than male people with COVID-19 were reported in Canada,46 but males had worse clinical outcomes,46–48 similar to the Medicare study.44 Males had higher net costs than females, perhaps owing to their overrepresentation in the highest level of care groups.
We found that mean net costs in the first 30 days peaked in both provinces for patients 70–79 years of age and then decreased. Our findings of lower costs among those 80 years and older were similar to the Medicare study.44 Older adults receive less aggressive care in hospitals than younger adults and tend to have higher mortality.44,49,50 As we expected, those with higher comorbidity also incurred higher net costs.
Residents of LTC facilities had high rates of SARS-CoV-2 infection and mortality, and low rates of hospital admission and ICU admittance51 during the first wave of COVID-19 in Ontario. Our cost analyses suggested that residents of LTC facilities in Ontario who remained in LTC during the first 2 weeks after the index date received less health care than controls. Ontario LTC facilities had a 30% decrease in transfers to hospitals between Mar. 1 and Aug. 31, 2020, compared with the previous year,52 probably because of provincial “care-in-place” recommendations that discouraged hospital transfers, and advance directives for individual residents that included orders not to admit to hospital.52 Treatment options requiring sedation (i.e., ventilators) might have been restricted for LTC residents with comorbidities such as dementia. This is a potential future research question beyond the scope of the present study.
People residing in LTC facilities at the time of their positive SARS-CoV-2 test result made up 18% of the cases in Ontario but only 12% of the cases in BC. Long-term care facilities in BC had better preparedness for the pandemic than those in Ontario and implemented measures that reduced the spread of infection.27 Facilities in BC had fewer shared rooms, fewer for-profit LTC homes, comprehensive instead of risk-based (in Ontario) inspection and a more stable health system organizational structure.27,53 Pandemic-response messaging, which included limiting workers to a single LTC home and starting infection and control policies, was more consistent in BC and began on Apr. 10, 2020, in BC and Apr. 15, 2020, in Ontario.27,54,55 However, mean net costs for those who remained in LTC after their positive SARS-CoV-2 test result were similar between provinces, and their 30-day survival was 67% in BC and 73% in Ontario. Previously reported fatality rates for those with COVID-19 among residents of LTC facilities in BC and Ontario were similar, at 33.5% and 30.5%, respectively, up to Sept. 10, 2020.27
We captured direct costs for almost all health care resources for most people with a positive SARS-CoV-2 test result in 2 populous Canadian provinces during the first wave.9 Despite differing health care costs and structures, the similar demographics of people with COVID-19 suggest that differences in management strategies between BC and Ontario could be further explored to strengthen future pandemic responses.
This interprovincial comparison adds to the literature of BC–Ontario COVID-19,26,27 and costing studies.10 Our study contributes relevant and actionable information on costs attributable to COVID-19 based on level of care, age and comorbidity. Our findings set a benchmark for the per-person costs of health resource use attributable to COVID-19 and provide policy-makers with robust estimates for effective system planning for upcoming COVID-19 waves.
Limitations
We included people with positive SARS-CoV-2 test results in OLIS14 and the BC COVID-19 laboratory test database, 13,18,20,21,23 which were fewer than those reported by Public Health Ontario17 and the BC Centre for Disease Control.5 Furthermore, testing was limited during the early stages of COVID-19 and case counts are likely underestimated, particularly for cases in the community and LTC levels of care.
We estimated direct medical costs based on individual-level health service use captured in the provincial administrative data. These likely underestimate health care costs. With the exception of the BC PharmaNet database, which captures both publicly and privately paid prescription drug costs, the data do not capture indirect or out-of-pocket health care costs.56 Additional expenditures related to COVID-19, such as pandemic pay for health care workers, personal protective equipment and nasopharyngeal swab kits,57 were not captured in our cost estimates. Furthermore, our hospital-based cost estimates used CIHI’s resource intensity weights (RIW) method, which relies on unit costs derived from previous years’ data. The effects of COVID-19 on these parameters are yet to be reflected in the RIW.
We present costs as observed, conditional on survival to the start of each 30-day period and unweighted for censoring. As a consequence, these total costs are likely underestimated. Even though net costs for the ICU groups remained high by 90–120 days, at $2329 (BC) and $3562 (Ontario), these costs are likely underestimated because of a high proportion of censoring during this period.
Our study design included a minimum of 1-month follow-up and costs reported for the preindex and first 30 days are complete, but costs reported for days 31–120 are subject to censoring. For the community and LTC levels of care, where censoring rates were highest, we observed that the net costs beyond 30 days were near 0, which suggests that the size of the bias may be relatively small. For hospital and ICU patients, for whom net costs remain elevated over time, the size of the bias may be larger.
We report only on the direct health care costs for patients with COVID-19 during the first wave. Considering the changing available treatments, treatment patterns, vaccination coverage and outcomes, health care costs in subsequent waves would likely change.
Finally, administrative data lack sufficient clinical information to determine phases of care for COVID-19. Our observation period covered short-term health care costs attributable to COVID-19 up to 120 days but did not capture long-term complications.
Conclusion
We provide comprehensive population-based estimates of direct medical costs for people with COVID-19 in 4 settings of initial care in BC and Ontario for the first wave of the pandemic.
Reducing both the number of people who acquire COVID-19 and the severity of illness is required to mitigate the impact of COVID-19 on health care budgets. Understanding health care costs highlights the importance of adequate infection control and public health measures to reduce health care costs and the clinical impact of COVID-19, and plan for recurrent COVID-19 waves.
Acknowledgement
The authors thank IQVIA Solutions Canada Inc. for use of their Drug Information File.
Footnotes
↵* Dr. Murray Krahn, a member of the Toronto Health Economics and Technology Assessment (THETA) Collaborative, died on July 1, 2022, during preparation of this manuscript for publication.
Competing interests: None declared.
Disclaimer: George Tomlinson is a biostatistical consultant for CMAJ Open and was not involved in the editorial decision-making process for this article.
This article has been peer reviewed.
Contributors: Teresa Tsui and Seraphine Zeitouny are joint first authors. Reka Pataky and Murray Krahn are joint senior authors. Murray Krahn, Girish Kulkarni, Karen Bremner, Douglas Cheung, George Tomlinson, Andrew Mendlowitz, Jennifer Walker and Stuart Peacock contributed to the conception and design of the work. Ruth Croxford, Seraphine Zeitouny, Reka Pataky and Paulos Teckle analyzed the data. Kimberlyn McGrail, Reka Pataky, Seraphine Zeitouny, Paulos Teckle and Stuart Peacock contributed to the acquisition of data in British Columbia. Teresa Tsui, Murray Krahn, Karen Bremner, Douglas Cheung, Ruth Croxford and Girish Kulkarni designed the cohort selection plans in Ontario. Kamil Malikov contributed to acquisition of Ontario Ministry of Health data. All authors contributed to interpretation of the data. Teresa Tsui, Karen Bremner, Reka Pataky and Seraphine Zeitouny drafted the manuscript. All of the authors critically revised the manuscript for important intellectual content. All of the authors, with the exception of Murray Krahn, gave final approval of the version to be published and agreed to be accountable for all aspects of the work.
Funding: This study was funded by a Canadian Institutes of Health Research operating grant: COVID-19 Rapid Research Funding Opportunity (funding reference number VR4 172774). This work was also undertaken, in part, with funding from the Canada Research Chairs program to Murray Krahn, Beate Sander and Jennifer Walker, and an Ontario Early Researcher Award to William Wong. The Canadian Centre for Applied Research in Cancer Control is funded by the Canadian Cancer Society.
Data sharing: In Ontario, the data set from this study is held securely in coded form at ICES. Although legal data-sharing agreements between ICES and data providers (e.g., health care organizations and government) prohibit ICES from making the data set publicly available, access may be granted to those who meet prespecified criteria for confidential access, available at https://www.ices.on.ca/DAS (email: das{at}ices.on.ca). The full data set creation plan and underlying analytic code are available from the authors upon request, with the understanding that the computer programs may rely upon coding templates or macros that are unique to ICES and are therefore either inaccessible or may require modification.
Supplemental information: For reviewer comments and the original submission of this manuscript, please see www.cmajopen.ca/content/10/3/E818/suppl/DC1
Disclaimer: In British Columbia, access to data provided by the Data Steward(s) is subject to approval but can be requested for research projects through the Data Steward(s) or their designated service providers. All inferences, opinions and conclusions drawn in this publication are those of the author(s), and do not reflect the opinions or policies of the Data Steward(s).
ICES Disclaimer: This study was supported by ICES, which is funded by an annual grant from the Ontario Ministry of Health (MOH) and the Ontario Ministry of Long-Term Care (MLTC). The analyses, conclusions, opinions and statements expressed herein are solely those of the authors and do not reflect those of the funding sources; no endorsement is intended or should be inferred. Parts of this material are based on data and information compiled and provided by the MOH. The analyses, conclusions, opinions and statements expressed herein are solely those of the authors and do not reflect those of the funding or data sources; no endorsement is intended or should be inferred. Parts of this material are based on data and information provided by Ontario Health (OH). The opinions, results, view, and conclusions reported in this paper are those of the authors and do not necessarily reflect those of OH. No endorsement by OH is intended or should be inferred. Parts of this material are based on data and/or information compiled and provided by the Canadian Institute for Health Information (CIHI). However, the analyses, conclusions, opinions and statements expressed in the material are those of the author(s), and not necessarily those of CIHI.
This is an Open Access article distributed in accordance with the terms of the Creative Commons Attribution (CC BY-NC-ND 4.0) licence, which permits use, distribution and reproduction in any medium, provided that the original publication is properly cited, the use is noncommercial (i.e., research or educational use), and no modifications or adaptations are made. See: https://creativecommons.org/licenses/by-nc-nd/4.0/
References
- © 2022 CMA Impact Inc. or its licensors
In this issue

Article tools


