


Abstract
Background: Upper extremity (UE) trauma represents a common reason for emergency department visits, but the longitudinal economic burden of this public health issue is unknown. This study assessed the 3-year attributable health care use and expenditure after UE trauma requiring acute surgical intervention, with specific focus on injuries that affect function of the hand and wrist.
Methods: We conducted an incidence-based, propensity score–matched cohort study (2006–2014) in Ontario, Canada, using linked administrative health care data to identify case patients and matched control patients. We matched adults with hand, wrist and UE nerve trauma requiring surgery 1:4 to control patients. We compared total direct health care costs, including 1-year pre-index costs, between case and control patients using a differences-in-difference methodology. The primary outcome was attributable health care costs within 3 years of injury.
Results: We matched patients with trauma (n = 26 123) to noninjured patients (n = 104 353). Mean direct health care costs attributable to UE trauma were $9210 (95% confidence interval [CI] 8880 to 9550) within 3 years. Patients with trauma had significantly more emergency department visits (≥ 3 visits: 25% v. 12%; p < 0.001), mental health visits (34% v. 28%; p < 0.05) and secondary surgeries (25% v. 5%; p < 0.001). Specific patient populations had significantly greater attributable costs: patients requiring post-traumatic mental health visits ($11 360 v. $7090; p < 0.001), inpatient surgery ($14 060 v. $5940, p < 0.001) and complex injuries ($13 790 v. $7930; p < 0.001).
Interpretation: Health care expenditure increased more than fivefold in the year after UE trauma surgery and remained greater than the matched cohort for the subsequent 2 years. Those with more serious injuries and post-injury visits for mental health were associated with higher costs, requiring further study for this public health issue. The mean 1-year pre-injury and 1-year post-injury total costs were $1710 and $9350, respectively.
Upper extremity (UE) trauma — specifically, hand and wrist trauma — is a substantial public health issue representing a common presentation to the emergency department.1–7 Injuries at different levels in the UE affect hand and wrist function and include wounds and vascular, nerve and musculoskeletal injuries. The frequency of these injuries is increasing secondary to population growth and aging and associated with rising health care costs for acute and ongoing care.3 Large volumes of UE trauma have the potential to create a sizable impact on the health care system. Although existing data report the health system cost of acute trauma care for UE,1–3,6 little is known about longitudinal health care costs.
Longitudinal cost estimates of UE trauma provide evidence for hospital administrators, policy decision-makers and researchers assessing novel prevention strategies and care pathway models. The primary objective of this population-based study was to determine the attributable long-term direct health care costs and utilization after UE trauma that required acute surgical intervention, with a specific emphasis on hand, wrist and UE peripheral nerve injuries. We employed an attributable cost methodology, which provides the most accurate representation of health care cost.8,9
Further, we sought to identify key high-cost populations for targeted needs assessment and program development and the impact of patient-specific factors on health care utilization and cost.
Methods
Study design and setting
Through a difference-in-difference costing methodology,10,11 we performed an incidence-based, propensity score–matched cohort study. We followed the Strengthening the Reporting of Observational Studies in Epidemiology (STROBE) reporting guideline.12 Adult residents of Ontario (age 18–65 yr) presenting to the emergency department with an isolated UE trauma (April 2006–March 2014) were eligible for inclusion.
Data sources
Appendix 1, Supplementary Table 1 (available at www.cmajopen.ca/content/11/1/E13/suppl/DC1) shows the key databases used for this study. These databases contain claims or records of nearly all provider information on publicly funded health care interactions and demographic characteristics of Ontario residents. These data sets have undergone quality reviews17–19 and have been used to estimate costs.20–23
Surgical hand trauma matched cohort baseline characteristics (index dates between Apr. 1, 2006, and Mar. 31, 2014)
Study samples
To the best of our knowledge, there is no algorithm to identify adult residents with UE trauma from the Discharge Abstract Database14 or National Ambulatory Care Reporting System.15 Linkage across databases is performed for each case and control patient, based on the assigned ICES Key Number. We took a comprehensive approach to identify patients:3 we identified UE trauma as a primary diagnosis of acute hand, wrist, forearm or UE peripheral nerve injury using the International Statistical Classification of Diseases and Related Health Problems, 10th Revision (ICD-10) (Appendix 2, Supplementary Table 2, available at www.cmajopen.ca/content/11/1/E13/suppl/DC1). We included index episodes if surgical intervention was required (see OHIP procedure codes, Appendix 3, Supplementary Table 3, available at www.cmajopen.ca/content/11/1/E13/suppl/DC1). We excluded patients who were uninsured, had missing demographics or polytrauma, or had sustained a pre-index UE trauma within 4 years. We matched control patients (Ontario residents aged 18–65 yr) 4:1 to case patients and provided an estimation of baseline medical costs without UE trauma when calculating attributable costs.
Costs attributable to upper extremity injuries within 3 years of the index event (2019 Canadian dollars)
Health care sector utilization in case and control patients within 3 years
The matching algorithm incorporated index event (month and year), sex, age at index (± 1 yr), mental health and addiction (MHA) utilization 1 year pre-index and the logit of the propensity score using nearest neighbour matching, with the allowance of a 0.2 standard deviation caliper width of the logit of the propensity score.24 We assessed balance between case and control patients for each variable, with standardized differences of less than 0.1 indicating good balance.25,26 Probabilistic assignment of control index dates (month or year) was based on the distribution of the index dates in the cases. Propensity score model variables included predictors of health care costs or utilization:27 comorbidity,28 income quintile,29,30 residential location31 and marginalization.32
Comorbidity status was based on the adjusted clinical groups derived from the Johns Hopkins ACG System, Version 10.33,34 Residency measures included the Local Integrated Health Network, Ontario’s regional health authorities35 and the Rurality Index of Ontario (RIO-2008).31 To assess inequalities between population groups and geographical areas, we used the Ontario Marginalization Index.32 We used neighbourhood income quintile as a surrogate measure for socioeconomic status.29,30 We identified MHA services utilization using a validated algorithm,36 which includes acute admission, emergency department and outpatient visits for and MHA diagnosis.
Injury-related variables were based on the ICD-10 diagnoses. The primary diagnosis defined the injury type: amputation, burn, crush or mangle, dislocation, fracture, ligamentous injury, nerve injury, tendon injury, vascular injury, open wound, other musculoskeletal injury, or unspecified UE injury. Complex injuries had 2 or more UE ICD-10 diagnoses (Appendix 2, Supplementary Table 2) in the diagnostic fields.
Outcomes
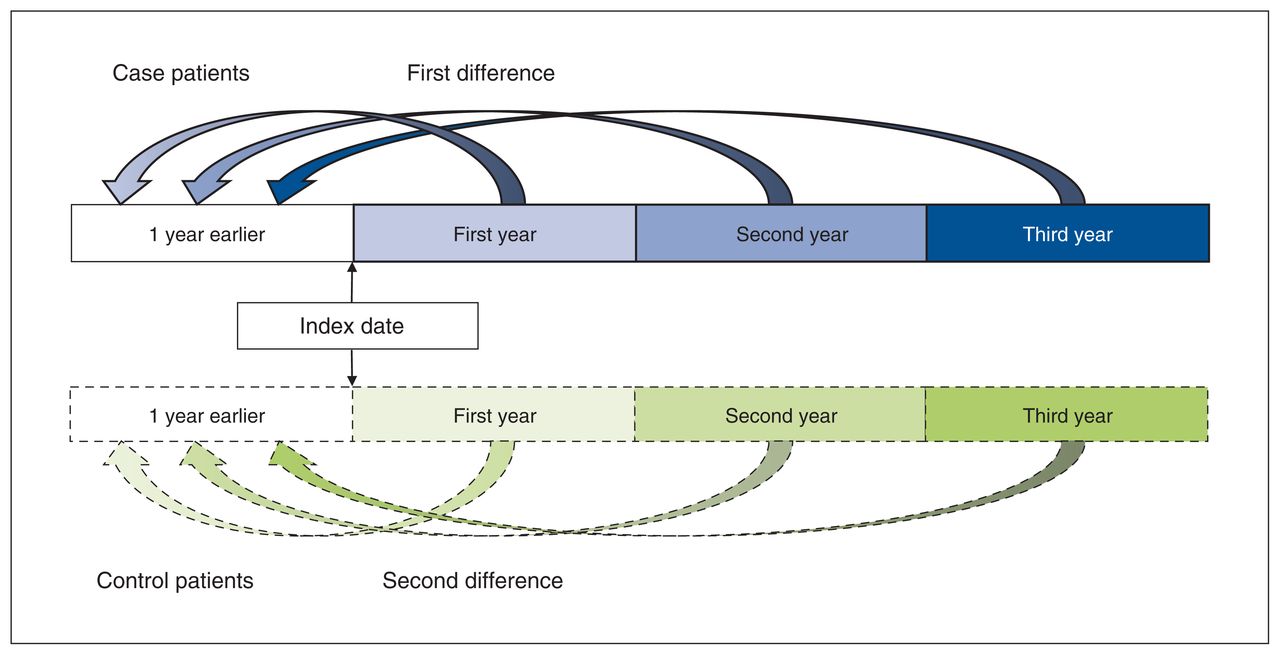
The primary outcome was health care costs attributable to the trauma and included only direct medical costs borne by the Ministry of Health and Long-Term Care (now the Ministry of Health and Ministry of Long-Term Care). We used a validated algorithm developed for Ontario population health administrative data to estimate resource utilization and compute individual-level health care costs over a 3-year period after the index date.20,36 Appendix 4, Supplementary Table 4 (available at www.cmajopen.ca/content/11/1/E13/suppl/DC1) provides a summary of the service types, weights and unit costs included in the algorithm. We considered 3 years to be long term in this population, based on the first author’s (H.L.B.) surgical experience at a tertiary-level hand program. We categorized costs as acute care hospital (emergency department, index admission, rehabilitation and 30-day readmissions), physician services, medications and laboratory costs outside of hospitals, continuing residential care and assistive devices.27,37 We adjusted costs to 2019 Canadian dollars based on the health care component of the Consumer Price Index (https://www.statcan.gc.ca/). We averaged costs for each foursome of control patients to represent 1 individual, accounting for the 4:1 matching. We estimated the attributable costs after the index trauma using a difference-in-differences approach. We calculated the differences by subtracting the costs in the baseline year from the costs in the first-, second- and third-year health care costs. We then compared the first difference (case patients) with the second difference (control patients) (Figure 1).10,11 This calculation was done at the individual level. Secondary outcomes included health care utilization after the index date: hospital admissions, emergency department visits, family physician visits, surgical care and aftercare, and MHA service utilization.
Attributable health care costs within 3 years for all injuries and by injury type (2019 Canadian dollars)

Schematic representation of the attributable cost calculation. For each isolated case of adult hand and wrist trauma, we identified 4 control patients without hand and wrist trauma, based on matching and propensity score. We estimated pre-index total health care costs and subtracted them from 1-, 2- and 3-year costs for case (first difference) and control patients (second difference). The control costs were weighted according to the number of matches per case. We compared the second difference with the first difference to attain the attributable health care costs arising from isolated hand and wrist trauma among adults.
Statistical analysis
We calculated mean attributable costs with 95% confidence intervals (CIs). We calculated CIs assuming a normal distribution, as all cases (simple to complex) were included. We calculated means for attributable costs in strata formed by age, sex, surgery type, injury type and complexity, and pre- and post-index MHA utilization for comparison. We compared attributable costs in strata using independent sample t-tests. In these stratified analyses, mean standardized differences (MSDs) greater than 10% indicated meaningful differences.25,26 We categorized health care utilization based on frequency of hospital admissions, same-day surgery, emergency department, family physician and any MHA service visits in a similar fashion to previous utilization descriptions.38 We compared binary and categorical utilization data between case and control patients using the χ2 test and compared numerical data using 1-way ANOVA. We calculated annual incidence rates with 95% CIs using annual Ontario population data39 and expressed them as the number of index traumas per 10 000 person-years. We performed all analyses using SAS software (SAS version 9.3); the type I error probability was 0.05.
Ethics approval
Institutional research ethics board approval was granted by the Health Sciences Research Ethics Board at the University of Toronto.
Results
Patient and control samples
Matching was successful for 26 123 (99.9%) patients with trauma to noninjured control patients (n = 104 353) with complete 3-year follow-up for 99.1% of case (n = 25 875) and control patients (n = 106 388) (Figure 2 and Appendix 5, Figure 1, available at www.cmajopen.ca/content/11/1/E13/suppl/DC1). Follow-up was incomplete owing to death in 0.9% of case (n = 248) and control patients (n = 970). After matching, all standardized differences for the baseline covariates were 0.1 or less (Table 1). Baseline utilization of health care was similar between case and control patients, demonstrated by mean (standard deviation) health care costs in the year before index date ($1710 [95% CI $1640–$1780] and $1770 [95% CI $1730–$1820], respectively. The trauma cohort included 26 141 patients (incidence rate 3.6/10 000 person-years, 95% CI 3.4–3.87): male (64.3%); mean age of 41.8 ± 13.62 years.
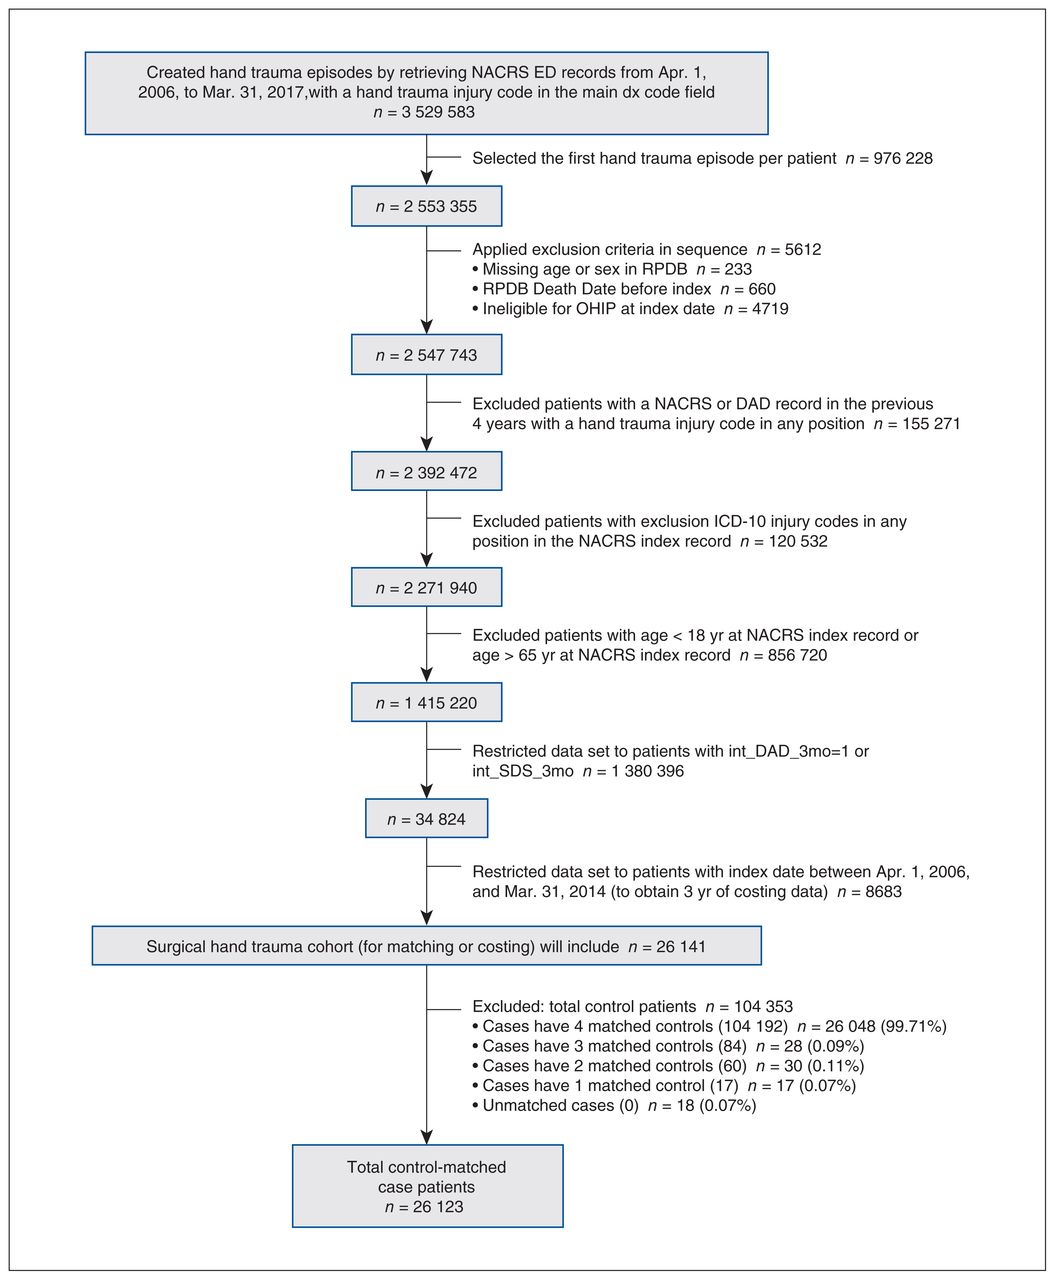
Flow diagram of inception cohort creation with inclusion and exclusion criteria. Note: DAD = Discharge Abstract Database, ED = emergency department, ICD-10 = International Statistical Classification of Diseases and Related Health Problems, 10th Revision, NACRS = National Ambulatory Care Reporting System, OHIP = Ontario Health Insurance Program, RPDB = Registered Persons Database, SDS = same-day surgery.
Patient-level costing
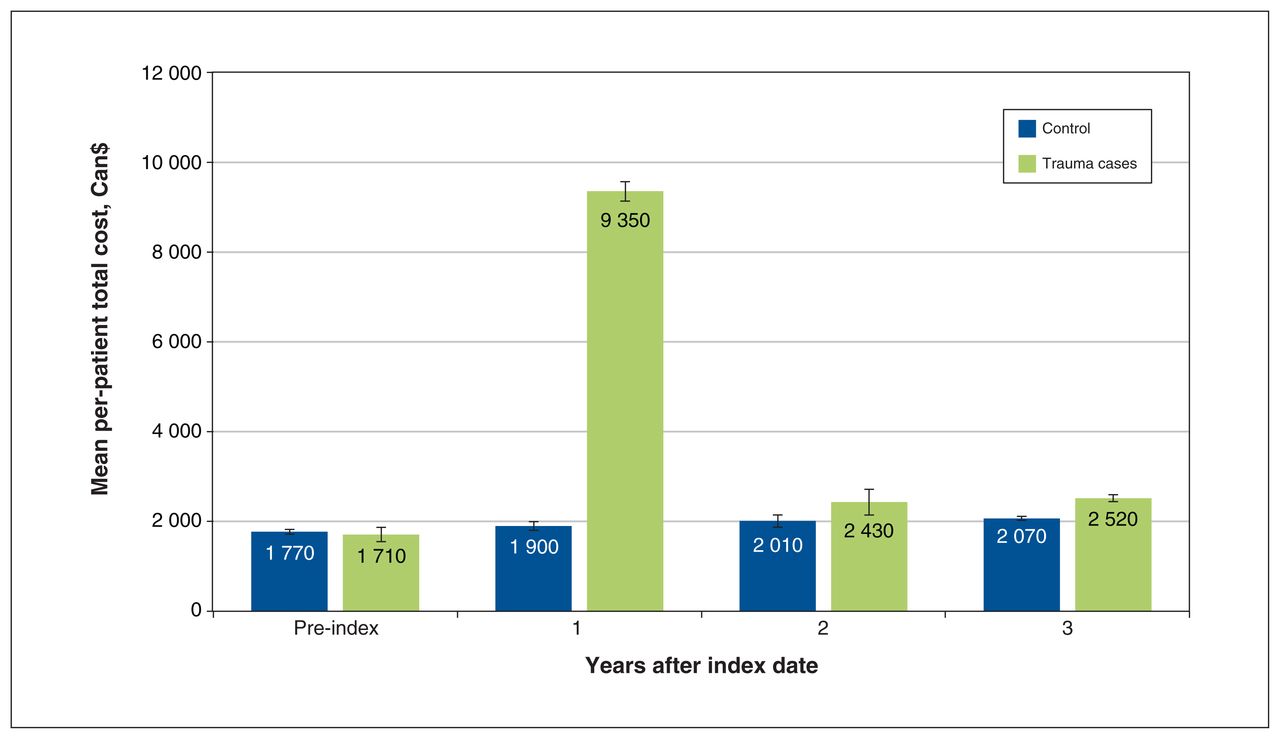
The health care expenditures of case and control patients differed significantly after the index date. Mean total health care costs increased more than fivefold, from $1710 in the pre-index year to $9350 (95% CI $9370–$9510; median: $6930; interquartile range [IQR] $4840–$9960) 1-year posttrauma and further to $14 300 (95%CI $14 010–14 590; median: $9160; IQR $6110–14 580) within 3 years. Mean total health care expenditures remained stable among control patients from pre-index ($1770) to 1 year post-index ($1900; 95% CI $1850–$1950; median: $370; IQR $100–$1160) and within 3 years ($5980; 95% CI $5840–$6120; median: $1530; IQR $520–$4500). Mean direct health care costs attributable to UE trauma within 3 years of the event were $9210 (95% CI $8880–$9550) (Table 2). Two-thirds of these costs occurred within 30 days ($6150) of the index trauma and 88% within the first year ($8120); however, health care expenditure remained greater in years 2 and 3 after trauma than for control patients (Figure 3; p < 0.001). Health care costs were predominantly attributed to physician fees (25%), inpatient care (28%) and outpatient costs (34%) (Table 2).

Total health care costs and 95% confidence intervals for 1 year before index date and 1–3 years after index date.
Resource utilization
Trauma cases had greater resource utilization (Table 3): more frequent visits to family physicians (≥ 5 visits: 39% v. 34%; p < 0.001) and emergency department (≥ 3 visits: 25% v. 12%; p < 0.001). Patients with trauma were more likely to undergo at least 2 surgeries during follow-up (25% v. 5%; p < 0.001). At baseline, 18% of case and control patients accessed MHA services within the year before index. Although both cohorts demonstrated increased use of MHA services, the number of patients with trauma using these services increased to 34% versus 28% for control patients (p < 0.05).
Stratified analyses of health care data
Age and sex were not associated with increased attributable costs. Of case patients, 32% required inpatient surgery, which was associated with significantly greater 3-year attributable costs than outpatient surgery ($14 060 v. $5940 [MSD 0.29, p < 0.001]). Attributable costs continued to accrue 3 years after acute inpatient surgery, but not outpatient surgery (Figure 4A). Access to MHA services before injury did not lead to significantly greater attributable costs ($9570 v. $8920 [MSD 0.04, p < 0.002]). Yet, patients accessing services post-index showed greater health care costs than patients who did not have significantly greater 3-year attributable costs ($11 360 v. $7090 [MSD 0.15, p < 0.001]) with attributable costs continuing to accrue over 3 years (Figure 4B, Figure 4C).

Total attributable health care costs (95% confidence intervals) at 1, 2 and 3 years after hand, wrist and nerve trauma stratified by (A) inpatient and outpatient status for index surgery, (B) pre-index utilization of mental health and addiction (MHA) services, (C) post-index utilization of MHA and (D) injury complexity.
Attributable costs varied significantly across types of injury (Table 4), with costs significantly higher than the mean for all injuries after burns (n = 189), amputations (n = 1348), crush injuries (n = 198) and vascular injuries (n = 168). Complex trauma (n = 2676) resulted in costs nearly twofold for single-tissue injury ($13 790 v. $7930 [MSD 0.45, p < 0.001]) and continued to accrue over 3 years after injury (Figure 4D).
Interpretation
In our study, health care expenditure increased more than fivefold compared with baseline in the first year after surgical UE injuries. Although total health care expenditures decreased over the subsequent 2 years, they remained greater than the matched control population. Our findings showed additional sources of increased costs, such as increased utilization of primary health care and MHA services. Revision surgeries are required in a quarter of patients. More severe injuries requiring acute admission and surgery with more complex injury patterns were associated with higher attributable health care costs that accrued over the 3-year study period, indicating a potential high-cost patient population. Patients with UE trauma have a high need for MHA care, with 18% at baseline, increasing to 34% after surgery. Patients with MHA needs had significantly greater attributable health care costs, which continued to rise over 3 years.
An international review of cost-of-illness after hand and wrist trauma identified that the median cost per case was US$8207 (IQR $3858 to $33 939).40 Direct health care costs varied from US$34041 to US$25 966,42 with the greatest cost associated with complex saw injuries. These findings, although comparable to our study, are limited to the acute care period and represent total costs rather than the attributable or direct health cost estimate.8,9 Few studies have investigated the attributable longitudinal health care costs after trauma. One cost study of motorcycle and automobile collisions reported $5825 and Can$2995, respectively, over 2 years,27 which was substantially less than the attributable health care costs in this UE trauma cohort. One-year attributable costs of hip fractures in Ontario have been reported as greater than Can$39 000 and aggregate costs of Can$282 million.43,44 However, all hand, wrist and nerve trauma combined have an incidence of 211/10 000 person-years in Ontario.7 When excluding admission and surgical costs, through extrapolation of these per-person costs, the annual cost of all isolated hand, wrist and nerve trauma could exceed Can$395 million in the year after injury. Although the patient-level attributable costs are less than some other types of injury, the large volumes of UE injuries may lead to aggregate costs equal to or greater than these more costly conditions.
Injury and patient factors associated with increased attributable costs may represent high-cost patient populations using disproportionately more resources. More severe or emergent injuries were associated with higher attributable health care costs requiring more comprehensive acute care, including revision surgeries and lengthy follow-up over many years. These more severe injuries likely represent patients who require inpatient surgery, thus leading to increased attributable costs over 3 years.
In the general adult population in Canada, 10% report symptoms consistent with an MHA diagnosis.45 Our study found that a substantially larger proportion of patients accessed MHA services before (18%) and after injury (34%). These increased needs may relate to extensive posttraumatic physical and psychological adaptations required of these patients. The relationship between increased attributable costs and post-injury MHA needs requires further investigation to determine the driver of these costs. Previous studies have shown that patients with MHA diagnoses may have increased complications after trauma,45–51 which in this population would translate to longer rehabilitation and follow-up, and potentially higher surgical needs.
A better understanding of the high-cost patient populations who have UE trauma is warranted. The relationship of injury type to MHA needs requires additional study to identify the predictors of high costs and enable targeted programs, such as early MHA intervention. These strategies may help engagement in ongoing care, and reduction in complications and chronic pain associated with comorbid MHA diagnoses.49,51 Further, there is a need to use administrative health care data to guide population-level preventive guidelines and policies to reduce the health care burden that UE injuries create. Given the high incidence of UE trauma, including nonsurgical conditions, further study of the aggregate costs is necessary to definitively describe the economic burden of the public health issue.
Limitations
No validated algorithm exists to identify this patient population. We applied comprehensive diagnostic inclusion criteria, potentially leading to the inclusion of patients with nontraumatic causes or proximal injuries unrelated to hand and wrist function. As proximal injuries account for less than 1% of the entire cohort, it is very unlikely that their inclusion would influence the findings of this study. Although administrative data available for health care costing studies capture most of the publicly funded health care costs,37 unaccounted costs included patients receiving essential nonphysician treatments (e.g., physiotherapy) not reimbursed by the public payer system. Injured workers under the Workplace Safety Insurance Board may access their nonacute care outside of OHIP, potentially leading to an underestimate of the long-term costs. As there is no linkage between the OHIP and Workplace Safety Insurance Board databases, this discrepancy cannot be identified. Costs were included until 2014 and may not reflect changes to hand or wrist injury management. The costs described in this study included isolated UE injuries requiring acute surgery and did not include patients with polytrauma, emergency department procedures and nonsurgical treatment. The large standard deviations show that there is imprecision of the cost estimates, which is a challenge of working with large administrative data sets. We calculated the MSD at 10% as this is generally accepted to represent a meaningful difference;25,26 however, it should be noted that even a small MSD, when accumulated throughout the health care system, can create a sizable cost burden.
Conclusion
The economic burden of illness arising from UE trauma is substantial and contributes to ongoing health care system costs. These patients have increased health care needs after their acute care, including access to primary care providers and MHA services. We have identified patient groups that continue to accrue health care costs after their injury. These potential ongoing resources require additional study to better understand the role of targeted programs to reduce health care costs and improve health care experiences.
Footnotes
↵* Dr. Murray Krahn passed away on July 1, 2022, during preparation of this manuscript for publication.
Competing interests: None declared.
This article has been peer reviewed.
Contributors: Gillian Hawker, J. Charles Victor and Murray Krahn contributed to the conception and design of the work. Priscila Pequeno contributed to the acquisition, analysis and interpretation of data. Murray Krahn drafted the manuscript. All of the authors revised it critically for important intellectual content, gave final approval of the version to be published and agreed to be accountable for all aspects of the work.
Funding: This study was funded by Canadian Institutes of Health Research, Canadian Graduate Scholarship Program.
Data sharing: The data set from this study is held securely in coded form at ICES. While data sharing agreements prohibit ICES from making the data set publicly available, access may be granted to those who meet pre-specified criteria for confidential access, available at https://www.ices.on.ca/DAS. The full data set creation plan and underlying analytic code are available from the authors upon request, understanding that the computer programs may rely upon coding templates or macros that are unique to ICES and are therefore either inaccessible or may require modification.
Disclaimer: The study was supported by ICES, which is funded by an annual grant from the Ontario Ministry of Health and the Ministry of Long-Term Care. Parts of this material are based on data and information compiled and provided by the Ontario Ministry of Health and the Canadian Institute for Health Information. The analyses, conclusions, opinions and statements expressed herein are solely those of the authors and do not reflect those of the funding or data sources; no endorsement is intended or should be inferred.
Supplemental information: For reviewer comments and the original submission of this manuscript, please see www.cmajopen.ca/content/11/1/E13/suppl/DC1.
This is an Open Access article distributed in accordance with the terms of the Creative Commons Attribution (CC BY-NC-ND 4.0) licence, which permits use, distribution and reproduction in any medium, provided that the original publication is properly cited, the use is noncommercial (i.e., research or educational use), and no modifications or adaptations are made. See: https://creativecommons.org/licenses/by-nc-nd/4.0/
References
- © 2022 CMA Impact Inc. or its licensors
In this issue

Article tools


