


Abstract
Background The prevalence of obesity has increased over the past 3 decades, with a disproportionate growth in excessive weight categories (body mass index [BMI] 35.0–39.9 and BMI ≥ 40.0). The objective of this paper is to present the data for the past and current prevalence of adult obesity in Canada, together with future estimates.
Methods We calculated BMIs for adults aged 18 years and older who were not in long-term care using data from Canadian health surveys administered between 1985 and 2011. Calculation of the BMIs was based on self-reported heights and weights. The weight categories were as follows: normal (BMI 18.5–24.9), overweight (25.0–29.9), obese class I (30.0–34.9), obese class II (35.0–39.9) and obese class III (≥ 40.0). Outcome measures were prevalence of adult obesity according to BMI categories, nationally and provincially. We used regression analysis models to predict future prevalence of adult obesity up to 2019.
Results Between 1985 and 2011, the prevalence of adult obesity in Canada increased from 6.1% to 18.3%. Furthermore, since 1985, the prevalence of obesity in classes I, II and III increased from 5.1% to 13.1%, from 0.8% to 3.6%, and from 0.3% to 1.6%, respectively. Taking into account regional variations, we predict that, by 2019, the prevalence of obesity in classes I, II and III will increase to 14.8%, 4.4% and 2.0%, respectively, and that half of the Canadian provinces will have more overweight or obese adults than normal-weight adults.
Interpretation We found significant increases in the excessive weight categories of obesity, with continued increases predicted for all provinces up to 2019. Provincial variations in obesity prevalence were also significant. To address these projected increases and any subsequent burden on the health care system, a concerted effort must be made by the provinces to focus on the prevention, management and treatment of obesity in Canada.
Over almost the past 3 decades, the prevalence of obesity, defined by a body mass index (BMI) of 30 or higher, has increased in many parts of the world. In Canada, the prevalence of obesity began to increase steadily in the 1980s. According to the 1985 Canadian Health Promotion Survey, about 6.1% of Canadian adults were found to be obese, compared with 18.1% reported from the findings of the 2010 Canadian Community Health Survey (CCHS).1–3 These national figures mask the substantial provincial variations that exist.4,5
Obese people are at an increased risk of hypertension, type 2 diabetes, sleep apnea and cancer.6–8 Excess body weight can also affect quality of life, education and income potential,9–11 and increase the risk of premature death.12,13 Obesity is often categorized by BMI to reflect the increasing health risk of excess weight: class I (BMI 30.0–34.9), class II (BMI 35.0–39.9) and class III (BMI ≥ 40.0).14,15 The latter 2 categories are linked to much higher levels of morbidity, increased demands on the health care system and premature death.16–19 There has been a disproportionate increase in people within obesity classes II and III in Canada.2,20 Taking into account figures for the past 2 decades, the annual economic burden of obesity is now estimated to be between $4.6 billion and $7.1 billion,21,22 and it has been suggested that obesity contributes as much as, if not more than, smoking to the onset of disease.23
The purpose of this paper is to present the data for the past (10 yr) and current prevalence of adult obesity in Canada, together with future estimates. These data are important in monitoring and evaluating the effectiveness of population- and community-wide interventions aimed at reducing obesity, as well as in estimating the future burden on the health care system of disease associated with excess body weight.
Methods
Setting
We analyzed BMI data from cross-sectional Canadian health surveys administered to adults aged 18 years and older who were not in long-term care. In the first CCHS, conducted by Statistics Canada in 2000/01, only adults aged 20–64 years participated in the study. For subsequent surveys (i.e., 2003 onwards), adults were defined as aged 18 years and older.
Data sources
To examine the national obesity rates before 2000, we used data published from the 1985 and 1990 cross-sectional Health Promotion Surveys and the longitudinal 1994/95, 1996/97 and 1998/99 National Population Health Surveys.2 The 2000/01–2011 study sample was obtained from the cross-sectional CCHSs. For our analysis, we used data from the CCHS cycles 1.1 (2001), 2.1 (2003), 3.1 (2005) and 4.1 (2007) and from the 2007/08, 2009/10 and 2011 CCHSs. Full details of the study design and procedures have been reported previously.24–26 Because few data were reported from the Canadian territories, we did not include these data in the current analysis. Given the focus of the paper, we also did not include data from the underweight category.
Outcome measures
Body mass index values are categorized as follows: normal weight (BMI 18.5–24.9), overweight (BMI 25.0–29.9), obese class I (BMI 30.0–34.9), obese class II (BMI 35.0–39.9) and obese class III (BMI ≥ 40.0).14,15 In our study, BMI was calculated using self-reported heights and weights gathered from the 3 surveys.
Statistical analysis
National trends are presented from 1985 to 2011 and provincial trends from 2000/01 to 2011. We conducted subgroup analyses for national and provincial data, and for BMI category, by age and sex, and included percentage changes over time between 2000/01 and 2011. The interpretation of data on obesity prevalence by sex and age is limited for obese classes II and III owing to high sampling variability and the lack of data in the oldest age category (≥ 60 yr) for the 2000/01 CCHS. Some data points must be interpreted with caution, especially in the subgroup analysis. Such points are indicated in the tables. We estimated national and provincial prevalence rates for BMI categories to 2019. All surveys were weighted to be representative of both national and provincial populations. The 10-year historical BMI prevalence data between 2000/01 and 2011 were tested for linear, quadratic and cubic trends. Based on visual inspection and evaluation of the models, we chose a linear model as the best fit for the data and used it in the prediction analysis. The trend analysis was limited to 6 data points over a 10-year period, because the CCHS was only started in 2000. As a result, we used linear regression to estimate the future prevalence of obesity up to 2019.27 This linear line technique has been used frequently to describe population prevalence or growth, and to make predictions for the future. We performed data analyses using IBM SPSS Version 20.
Results
National results, 1985–2011
Between 1985 and 2011, the prevalence of adults in the overweight category increased by 21% from 27.8% to 33.6%, and the prevalence of obesity (BMI ≥ 30.0) increased 200% from 6.1% to 18.3%. All classes of obesity increased over this period, with disproportionate increases seen in the higher obese classes. The prevalence for obese class I increased from 5.1% to 13.1%, obese class II from 0.8% to 3.6%, and obese class III from 0.3% to 1.6% (Figure 1).
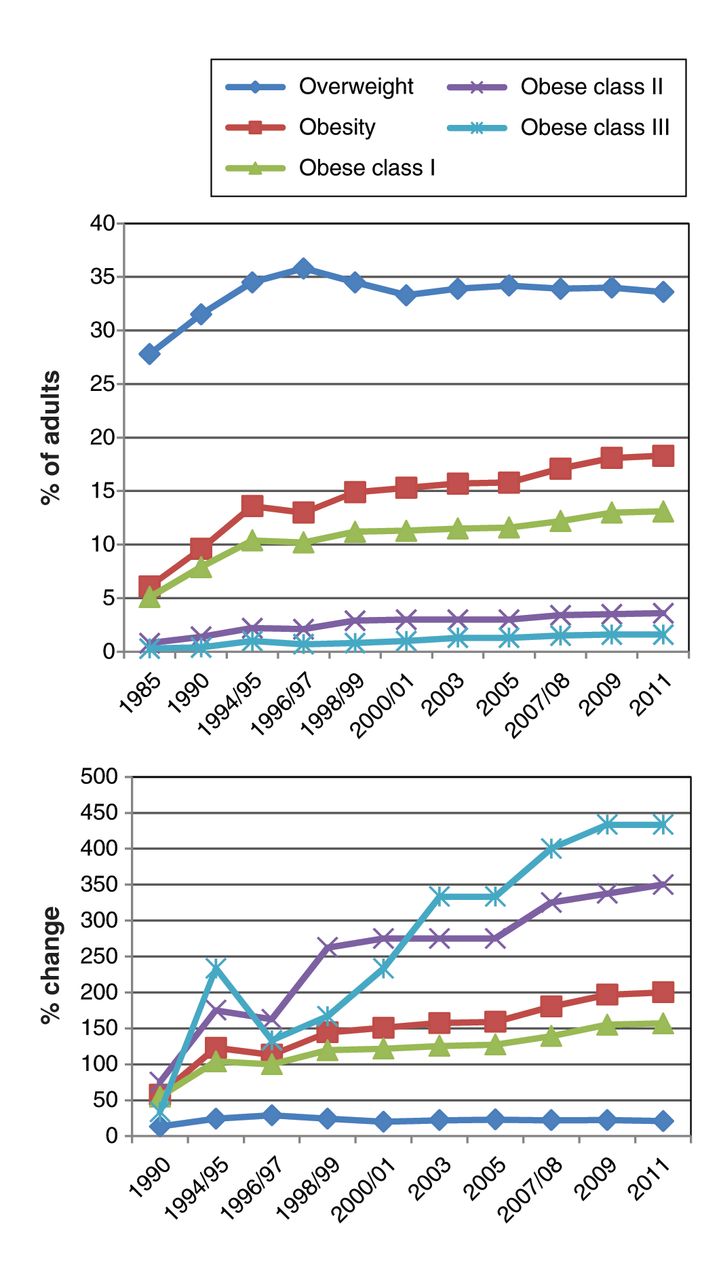
(A) Prevalence of adults classified as overweight or obese in Canada from 1985 to 2011, by weight category: overweight (BMI 25.0–29.9), obese (BMI ≥ 30.0), obese class I (BMI 30.0–34.9), obese class II (BMI 35.0–39.9) and obese class III (BMI ≥ 40.0). (B) Percentage change in the prevalence of overweight and obesity in Canada, by weight category, using 1985 data as a baseline. BMI = body mass index.
Provincial results, 2000/01–2011
Between 2000/01 and 2011, the prevalence of overweight decreased in Prince Edward Island, New Brunswick and Alberta, whereas there were increases in the other provinces. All provinces had increases in obese class I, II (except for Saskatchewan) and III. Lower prevalence rates of obesity were observed in the west and higher rates in the east. In 2011, the prevalence of overweight varied from 31.3% in British Columbia to 41.8% in Newfoundland and Labrador. The rate for obese class I varied from 10.7% in BC to 20.5% in Newfoundland and Labrador. For obese class II, New Brunswick reported the highest rate (6.1%) and Quebec the lowest (2.5%). For obese class III, New Brunswick reported the highest rate (2.8%), and BC and Quebec the lowest at 1.2% (Table 1). Appendix 1, available at www.cmajopen.ca/content/2/1/E18/suppl/DC1, shows the prevalence of BMI categories as reported by the CCHS for 2000/01 to 2011.
Subgroup analysis
BMI categories by sex and age
Table 2 shows the prevalence for the overweight and obese BMI categories by sex for 2000/01 and 2011, as well as national and provincial percentage changes. For women, increases in the overweight category were reported for most provinces (ranging from an increase of 3.8% in Ontario to an increase of 18.0% in Nova Scotia), with the exception of Prince Edward Island and Alberta, which had decreases of 24.5% and 6.1%, respectively. For overweight men, increases were reported in 6 of 10 provinces, ranging from 1.0% in Nova Scotia to 5.2% in Newfoundland and Labrador. Prince Edward Island, New Brunswick, Ontario and Alberta all had decreases in the prevalence of men in the overweight category, ranging from 0.5% in Alberta to 6.6% in New Brunswick. In both survey years, men were more likely to be overweight than women, a finding that was consistent across all provinces. Between 2000/01 and 2011, increases in the prevalence rate for the obese category (BMI ≥ 30.0) were reported for both women and men for all provinces. Across all provinces, there was a higher reported prevalence of men in the obese categories. Between 2000/01 and 2011, increases in prevalence were reported for women in obese class I for all provinces, except for New Brunswick and Saskatchewan, where the prevalence decreased by 1.3% and 3.1%, respectively. For men, an increased prevalence in obese class I was reported across all provinces. Overall, men were more likely than women to be categorized as obese class I. It is difficult to draw conclusions for the higher classes of obesity, because the data must be interpreted with caution; however, these data illustrate increases in the prevalence of both men and women in obese classes II and III. Women were more likely than men to be classified as obese class II and III.
Table 3 shows the prevalence for the BMI categories by age (18–39, 40–59 and ≥ 60 yr) for 2000/01 and 2011, showing both national and provincial percentage changes. There was a higher prevalence for the overweight and obese class I categories in the older age categories (40–59 and ≥ 60 yr) compared with the younger group. Subgroup analysis of the prevalence for obese classes II and III was limited owing to unreliable data.
Prediction analysis
National trends
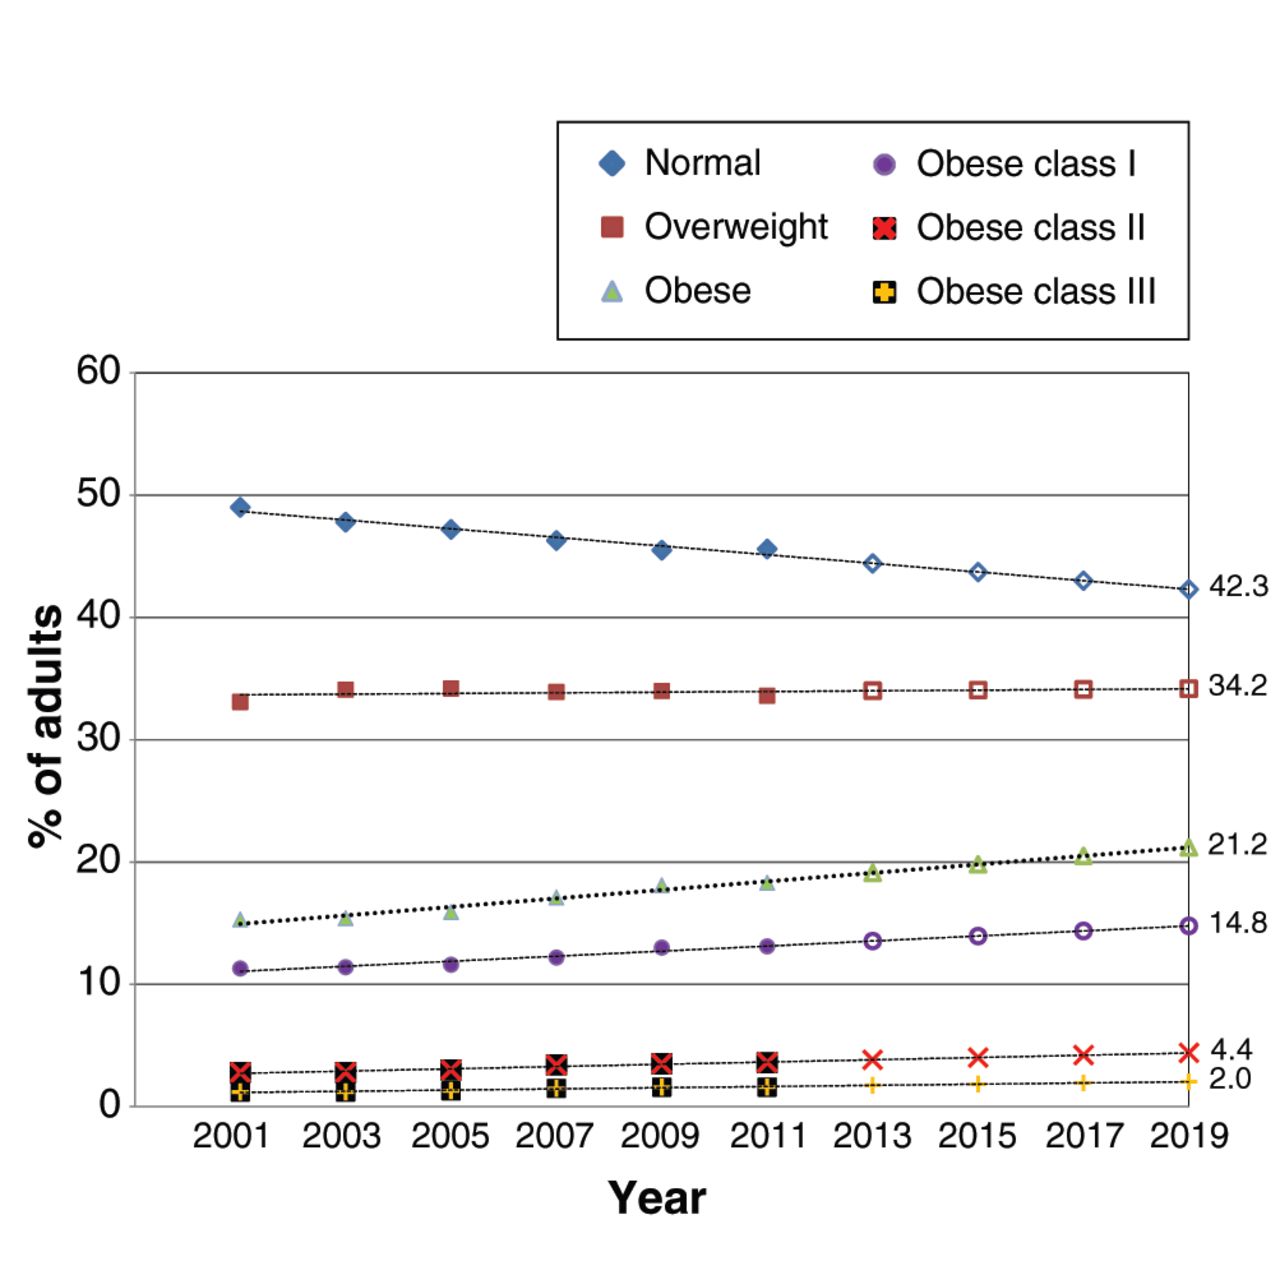
By 2019, we estimate that most (55.4%) of the Canadian adult population will be categorized as overweight (34.2%) or obese (21.2%). Furthermore, we estimate that the prevalence for obese classes I, II and III will increase to 14.8%, 4.4% and 2.0%, respectively (Figure 2).

Predictions of future prevalence of adult obesity in Canada, from 2013 to 2019, by weight category: normal (BMI 18.5–24.9), overweight (BMI 25.0–29.9), obese (BMI ≥ 30.0), obese class I (BMI 30.0–34.9), obese class II (BMI 35.0–39.9) and obese class III (BMI ≥ 40.0). BMI = body mass index.
Provincial trends
Appendix 2, available at www.cmajopen.ca/content/2/1/E18/suppl/DC1, shows the predicted prevalence for all BMI categories and all provinces. By 2019, an estimated 71% of the adult population in Newfoundland and Labrador will be overweight or obese. In Nova Scotia, New Brunswick, Saskatchewan and Manitoba, we estimate that there will be more overweight than normal-weight adults. In these provinces, the prevalence of adults in the overweight category will range from an estimated 34% to 38.5%, and the prevalence of adults categorized as obese will range from an estimated 25.0% to 30.7%. We estimate that Prince Edward Island, Ontario, Quebec, Alberta and BC will continue to have a lower prevalence for the overweight category (31.2%–34.6%) and obese category (15.7%–26.0%). Despite provincial variability, we predict increased prevalence for all obese classes in all provinces. Higher rates are predicted for eastern Canada, and lower rates for western Canada. Appendix 3, available at www.cmajopen.ca/content/2/1/E18/suppl/DC1, shows the regression analysis.
Interpretation
The results from our analysis show that the prevalence of normal-weight people in Canada is steadily decreasing, whereas the prevalence of all classes of obesity continues to rise, with the greatest percentage increases occurring in the excessive weight classes. In 2011, about 18.3% of adults in Canada were considered obese, equating to more than 4.8 million people with a BMI of 30.0 or greater.28 It is predicted that obesity rates will continue to rise in all provinces up to 2019. Our data show significant provincial variations in the prevalence and rate of change of obesity levels over time. For example, increases in the prevalence for obese class III were reported for all provinces; however, Newfoundland and Labrador showed a much higher rate of increase (73.3%) compared with the other provinces. Although subgroup analysis by sex and age was limited, the data suggested that the prevalence for obesity in both men and women had increased over the past decade, with men more likely to be categorized as obese class I, and women as obese class II or class III. With a few exceptions, the prevalence of overweight and obesity was higher in the older age groups (40–59 and ≥ 60 yr) than that for the younger age group (18–39 yr) in all provinces.
Similar to many countries, Canada has experienced a substantial increase in the prevalence of obesity.1,29–31 A report by the Organisation for Economic Co-operation and Development suggested that in some countries, including Canada, the prevalence of obesity will continue to rise at a predicted rate of 4%–5% per year.1 Although class I obesity appears to be increasing at a slower rate in Canada, the rate for the higher classes of obesity continues to increase disproportionately, a finding consistent with other studies.32–34 These results raise concern at a policy level, because people in these obesity classes are at a much higher risk of developing complex care needs.16,17,35 Our findings also show a continuing increase in the regional differences in the prevalence of obesity, results similar to findings reported in other studies.36–38 Possible explanations for these variations include population differences in levels of education and income, social class, age demographic, sex, ethnicity, genetic predisposition, and rural versus urban living. However, these relations are not always consistent between or within countries.4,5,22,39–42
Although rates of increase differ, our prediction analysis estimates a continued increase in obesity in all classes for all provinces from 2013 to 2019. Several prediction studies report continued increases in obesity rates.1,33,43 In the United States, it is estimated that by 2030, 42% of the adult population will be obese.33 In Australia, by 2025, most men (83%) and women (75%) will be either overweight or obese.43 In contrast, some countries are experiencing a leveling off of obesity rates, suggesting that country-specific efforts to curb obesity may be having an impact.1
In Canada, there is no country-wide coordinated effort to address the adult obesity epidemic. At federal, provincial/territorial and community levels, prevention and health promotion strategies have been established to increase levels of physical activity, improve healthy eating, and reduce the chronic disease burden of obesity. With this common goal in mind, programs across all levels of jurisdiction have been developed, which differ in concept, target audience and implementation techniques.40,44 Unfortunately, there is a lack of data available evaluating the effectiveness of these programs. Given the provincial variation in the prevalence of obesity, it may be that some provinces are more successful at implementing strategies aimed at promoting healthy lifestyles and weight-management behaviours. Without a complete synthesis of what each province is doing, it is very difficult to know if these differences can be explained by the uptake or implementation of federal, provincial, community-wide or local initiatives.44
One potential challenge to country-wide initiatives in Canada stems from the fact that although the publicly funded health system is governed by federal legislation (the Canada Health Act), the actual provision of health services comes under provincial and territorial jurisdiction. The act’s principles ensure some consistency among provincial/territorial health systems but cannot influence decisions on health priorities or the allocation of resources at the provincial/territorial levels. These will differ depending on priorities and budgets, and will directly affect the importance given to the health promotion, prevention, management and treatment of obesity. For example, provincial variations may exist in the provision of bariatric surgery to eligible patients for the treatment of morbid obesity,45 in the training or lack of training of health professionals in weight management,46,47 and in patient access to other types of expertise in weight loss such as dietitians and psychologists. In Canada, a number of resources exist to help health professionals provide evidence-based clinical care to obese patients, such as the clinical practice guidelines on the prevention, management and treatment of obesity,16 and the approach of the newly published Canadian Obesity Network 5-A’s (ask, assess, advise, agree and assist) approach to obesity management for primary care physicians.48 However, the uptake and implementation of these and other weight-management resources have not been studied or evaluated at a provincial level.
Limitations
The use of BMI as a measure of body fat does not differentiate between lean and fat tissue, and therefore its use in the clinical setting is limited.49,50 However, BMI remains useful for the purposes of tracking population trends and comparing obesity prevalence over time. In the current study, BMI in adults aged 18 years and older (with the exception of the 2000/01 CCHS, which was limited to adults aged 20–64 yr) was based on self-reported heights and weights, with the inherent limitation that people tend to underestimate their weight and overestimate their height.51 Consequently, this analysis provides conservative estimates of the current and future predicted prevalence of obesity in Canada.
A further limitation is the use of cross-sectional surveys with limited sample size for conducting meaningful subgroup analysis. Larger samples and longitudinal data would provide a more valid and reliable estimate of the prevalence of obesity and in which subgroups it changes over time. Nevertheless, the use of large, nationally representative data sets is a major strength of this study.
Finally, the trend analysis was based on the survey data collected over the last decade, which illustrates increases in a linear fashion. Other Canadian surveys (measured or self-reported) suggest that increases may have occurred at a much faster rate in the 1980s and 1990s, but that, in the past decade, this rate, although still increasing, may have slowed down.52 The validity of prediction analyses depends on the assumption that little change will occur during the predicted period. It is unlikely, in our predicted period, that demographic change, new pharmacologic agents or increased access to bariatric surgery will affect the accuracy of these predictions.
Conclusion
Since 1985, the prevalence of obesity has increased by 200% in Canada, with the highest increases occurring in the excessive weight categories. By 2019, it is predicted that about 21% of the Canadian adult population will be obese. Interprovincial variations show continued variation in the prevalence of obesity. With few exceptions, over the past 10 years, the incidence of obesity increased in all provinces, for both sexes, and across all age groups, but not at the same rate. An improved understanding of why such substantial interprovincial variations exist is necessary, including a focus on evaluating existing policies, programs and approaches to the prevention, management and treatment of obesity.
Acknowledgements
The researchers used data from Statistics Canada prepared by the Newfoundland and Labrador Centre for Health Information (Dr. Don MacDonald, Vice President of Research and Evaluation); however, the analyses and interpretations presented in the paper do not reflect the views of Statistics Canada.
Footnotes
-
Competing interests: None declared.
-
Contributors: Laurie Twells conceived the study concept and design and acquired the data. All of the authors contributed to data analysis and interpretation, and drafted and revised the manuscript. All of the authors approved the final version submitted for publication.
-
Funding: This project was investigator-initiated and received no funding.
References
- © 2014 Canadian Medical Association or its licensors
In this issue

Article tools


Related Articles
Cited By...
- Effect of bariatric surgery on cardiac function in obese patients: An echocardiographic assessment
- Factors influencing primary care provider referral for bariatric surgery: Systematic review
- Recent trends in adult body mass index and prevalence of excess weight: Data from the Canadian Primary Care Sentinel Surveillance Network
- Using the Edmonton Obesity Staging System in the real world: a feasibility study based on cross-sectional data
- Lobesite chez ladulte : ligne directrice de pratique clinique
- Obesity in adults: a clinical practice guideline
- Iron deficiency in bariatric surgery patients: a single-centre experience over 5 years
- The usefulness and costs of routine contrast studies after laparoscopic sleeve gastrectomy for detecting staple line leaks
- Laparoscopic sleeve gastrectomy at a new bariatric surgery centre in Canada: 30-day complication rates using the Clavien-Dindo classification
- Cause of death in patients awaiting bariatric surgery