


Abstract
Background: Nonpharmaceutical interventions (NPIs) are the primary tools to mitigate early spread of the coronavirus disease 2019 (COVID-19) pandemic; however, such policies are implemented variably at the federal, provincial or territorial, and municipal levels without centralized documentation. We describe the development of the comprehensive open Canadian Non-Pharmaceutical Intervention (CAN-NPI) data set, which identifies and classifies all NPIs implemented in regions across Canada in response to COVID-19, and provides an accompanying description of geographic and temporal heterogeneity.
Methods: We performed an environmental scan of government websites, news media and verified government social media accounts to identify NPIs implemented in Canada between Jan. 1 and Apr. 19, 2020. The CAN-NPI data set contains information about each intervention’s timing, location, type, target population and alignment with a response stringency measure. We conducted descriptive analyses to characterize the temporal and geographic variation in early NPI implementation.
Results: We recorded 2517 NPIs grouped in 63 distinct categories during this period. The median date of NPI implementation in Canada was Mar. 24, 2020. Most jurisdictions heightened the stringency of their response following the World Health Organization’s global pandemic declaration on Mar. 11, 2020. However, there was variation among provinces or territories in the timing and stringency of NPI implementation, with 8 out of 13 provinces or territories declaring a state of emergency by Mar. 18, and all by Mar. 22, 2020.
Interpretation: There was substantial geographic and temporal heterogeneity in NPI implementation across Canada, highlighting the importance of a subnational lens in evaluating the COVID-19 pandemic response. Our comprehensive open-access data set will enable researchers to conduct robust interjurisdictional analyses of NPI impact in curtailing COVID-19 transmission.
Since the first case of coronavirus disease 2019 (COVID-19) was reported in Canada in January 2020, there have been 122 669 cases and 9044 reported deaths as of Aug. 13, 2020.1 In the absence of population immunity, an effective vaccine or medical treatment, traditional public health interventions (e.g., physical distancing, testing, contact-tracing and hand hygiene) are critical to protect population health.2,3 These nonpharmaceutical interventions (NPIs) have been the primary tool employed by governments and organizations to “flatten the curve” and reduce the spread of the virus, avoiding the possibility that peak case numbers overwhelm health care capacity.2,4,5
In Canada, NPIs have included the closure of borders and bans on nonessential travel, as well as the imposition of voluntary or mandatory physical distancing measures. Although some NPI policies have been implemented at a national scale, much of the authority and responsibility to oversee rollout of these policies falls on provincial, territorial and municipal governments. 6 As such, there has been substantial variability in the type, duration and implementation of NPIs across Canada — highlighting the importance of a subnational (i.e., provincial, territorial and municipal) lens of data gathering and analysis. Understanding the nature and impact of the NPI response is central to understanding the series of natural experiments that have occurred across Canada’s first wave of the COVID-19 outbreak, and extracting lessons to inform ongoing policy-making.7
Although most interventions have been publicly announced through various media, there is no single comprehensive data set cataloguing the breadth and depth of interventions that have been implemented at all 3 levels of government in Canada; prominent global data sets lack data on the subnational scale.8,9 To fill this gap, we describe the development of a comprehensive open data set — Canadian Non-Pharmaceutical Intervention (CAN-NPI) — containing detailed information about all publicly available Canadian NPIs in response to COVID-19. We describe the type and frequency of NPIs implemented in Canada, and characterize the temporal and geographic heterogeneity in their implementation across the federal, provincial or territorial, and municipal levels.
Methods
Study design
A pan-Canadian team of medical and graduate health professionals and students conducted an environmental scan to identify all COVID-19–related NPIs. This methodology is appropriate for the rapidly evolving nature of the ongoing pandemic and the variety of avenues through which information is announced (Appendix 1, Figure S1, available at www.cmajopen.ca/content/8/3/E545/suppl/DC1). The initial collection period between Jan. 1, 2020 and the date of paper submission (Apr. 19, 2020) is presented in this paper. Data collected after this date continue to be updated online as per the data sharing statement.
In this data set, we defined an NPI as any publicly announced program, statement, enforceable order, initiative or operational change originating from any government body in response to COVID-19 — whether to curtail its transmission or mitigate its social and economic ramifications.3 This includes distancing measures (including closures), infection control measures (excluding vaccination or medical treatment), testing strategies, public announcements and social and fiscal measures, among others.
Data sources
A hierarchy of sources was used to identify interventions implemented by private and governmental organizations at 3 levels: the Canadian federal level, provincial and territorial level, and the municipal level for the 20 largest census metropolitan areas in Canada (with Ottawa-Gatineau separated into 2 municipalities in the data set) (Appendix 1, Table S1).
Official government sources (including releases from official websites of governments, ministries of health or public health commissions [Table 1]) were considered the highest calibre sources; these were reviewed in full and any COVID-19–related announcements were identified as the gold standard for data inclusion. Additional information was identified using purposive search methods for COVID-19–related articles and online reports from accredited news agencies. Additional information was identified using purposive search methods for COVID-19-related articles and online reports from accredited news agencies (local or national news services with a regular publishing schedule and genuine circulation, as determined by a subset of the authors [L.G.M. and J.S.]). Finally, we identified updates provided by the official social media accounts of governmental or public health institutions on Twitter or Facebook, and these were included if no other source was found.
Summary of nonpharmaceutical intervention counts and sources by region
Data collection
A team of 34 reviewers (including medical and health professionals) were involved in data collection. To ensure reviewer consistency, we established a streamlined data extraction protocol and a step-wise data-entry process. We used a standardized data extraction form to record information systematically for each NPI (Appendix 1, Table S2).
Characteristics of NPIs collected included start and end date, location, a free-text summary and categorical classifiers based on the intervention type, target population and nature of enforcement. Given the shifting nature of the pandemic response, our list of categorical classifiers was iteratively expanded and adjusted as novel classes of NPIs were identified, resulting in a total of 63 categories. Where applicable, interventions were also assigned a label that aligned with the Oxford COVID-19 Government Response Tracker (OxCGRT Version 4.0),8 a previously developed measure of government response. Interventions were recorded only for the administrative level for which they were implemented (e.g., provincial interventions were not recorded for municipalities). If an NPI was modified, an “end date” was added for the original version of the NPI, with the modified version recorded as a novel NPI.
Discrepancies in data extraction were discussed collectively by a subset of 5 authors (L.G.M., J.S., K.A., J.P. and I.B.) until consensus was reached. A focused second review of the data set was performed by the same subset of authors to identify and resolve discrepancies and to improve consistency across reviewers and jurisdictions.
Data analysis
We conducted a series of descriptive analyses to summarize NPI implementation spatially and temporally in Canada. We compared the proportion of different types of NPIs implemented in various jurisdictions. To assess and compare the rigor of COVID-19 responses enacted by each province and territory, we calculated Oxford Stringency Index (OSI) scores using previously developed methods,8 and visually present geographic and temporal variations (Appendix 1, Table S3). We compared the time-to-implementation of NPIs relative to case and death announcements in each jurisdiction. Finally, at the census metropolitan areas-level, we evaluated heterogeneity in NPI response by comparing the implementation of the 10 most frequently reported NPIs over time, as well as specifically for the implementation of event restrictions by size.
Ethics approval
Data were extracted from publicly available online sources, and therefore, according to Tri-Council Policy Statement (TCPS 2 2018; article 2.2), this type of research based solely on publicly available information is exempt from research ethics board approval.
Results
Temporal distribution of NPI implementation
Between Jan. 1, 2020 (24 d before the first case was reported in Canada10) and Apr. 19, 2020 (inclusive), we identified 2517 unique NPIs as summarized in Table 1. The temporal distribution of NPI implementation by daily count is displayed in Figure 1, indicating a sharp peak in NPI implementation during mid-March following minimal response in early March (5.48% [138] of NPIs implemented before the Mar. 11 WHO pandemic declaration11). The median NPI implementation date for Canada was Mar. 24, 2020, followed by a gradual decline in the announcement of new NPIs into April.
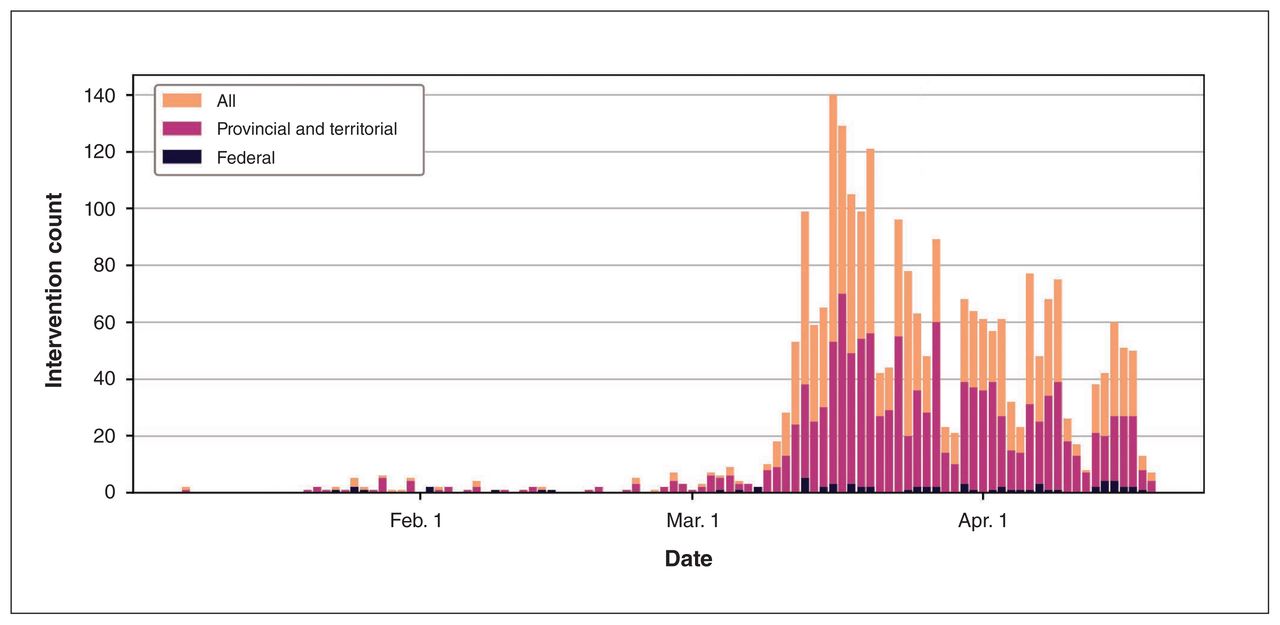
Temporal distribution of nonpharmaceutical interventions implemented across Canada from Jan. 1 to Apr. 19, 2020, in response to the coronavirus disease 2019 (COVID-19) pandemic (n = 2517).
Types of NPIs implemented most frequently
Of the 63 distinct NPI categories recorded in CAN-NPI, the 15 most frequently reported categories — along with illustrative examples — are listed in Table 2. The most common NPIs took the form of announcements for instructing or informing the public. There was variation among provinces and municipalities in the number of NPI categories implemented, as not all categories were implemented within each jurisdiction and some jurisdictions used more NPI categories than others (Table 1).
The 15 most frequently recorded nonpharmaceutical intervention categories by count with descriptive examples
Oxford Stringency Index scores
A subset of 37% (920) of the NPIs in our data set were additionally categorized under the OxCGRT labels suitable for calculating an OSI. We found that OSI scores evolved over time across the country (Figure 2). Overall, Canada’s OSI score was 19.05 on Mar. 10, 28.57 on Mar. 11, 38.1 on Mar. 15 and 57.14 on Mar. 18, 2020. In early March, provinces and territories responded to COVID-19 at varying degrees of stringency, with British Columbia enacting the most rigorous measures before the WHO pandemic declaration. All provinces and territories heightened their responses following the declaration, with both BC and Newfoundland and Labrador scoring highest on the OSI by Mar. 31, 2020. There were minimal changes in OSI scores between Mar. 31 and Apr. 11, 2020 (1 month after the WHO’s pandemic declaration), excepting slight increases for Manitoba and the Yukon.

Oxford Stringency Index8 in Canada by province and territory over time (n = 841). Note: COVID-19 = coronavirus disease 2019, WHO = World Health Organization.
Time-to-implementation
Relative to first case and death announcements, we found regional variation in the time-to-implementation of 2 major types of NPI: declaration of state of emergency (including public health emergency) and school closure (Figure 3). Quebec was the first province in the country to enact a state of emergency (Mar. 13, 2020) and Nova Scotia was the last (Mar. 22, 2020). Five provinces and territories declared their states of emergency on the same day, Mar. 18, 2020, while all 3 territories declared a state of emergency before their first case. Ontario was the first to mandate school closures (Mar. 13, 2020), while Manitoba was last (Mar. 23, 2020).

Variation in time-to-implementation for 2 major nonpharmaceutical interventions (NPIs) — declaration of state of emergency and school closure — shown relative to 2 descriptors of the local coronavirus disease 2019 (COVID-19) outbreak (dates of first case and first death) by Canadian province and territory. Note: WHO = World Health Organization.
NPI responses by municipalities
There was also variation among municipalities in the timing and categories of NPIs implemented. Of the 10 most frequently reported NPI categories at the municipal level, Montréal, Vancouver and Ottawa enacted all 10 by Apr. 19, 2020 (Figure 4). The earliest response came in Toronto and Kitchener-Waterloo, each enacting 1 NPI by Mar. 8, 2020, after which more municipalities followed suit and implemented NPIs in a stepped fashion. This increase in stringency over time is reflected in event size restrictions (Figure 5). On Mar. 12, 2020, Toronto and Vancouver began restricting all events with more than 250 attendees, followed by 5 other municipalities in the following 2 days. Later, all municipalities issued stricter restrictions.

Implementation of 10 most frequently reported nonpharmaceutical interventions (NPIs) at the municipal level in Canada by census metropolitan areas (ranked by population size) over time.
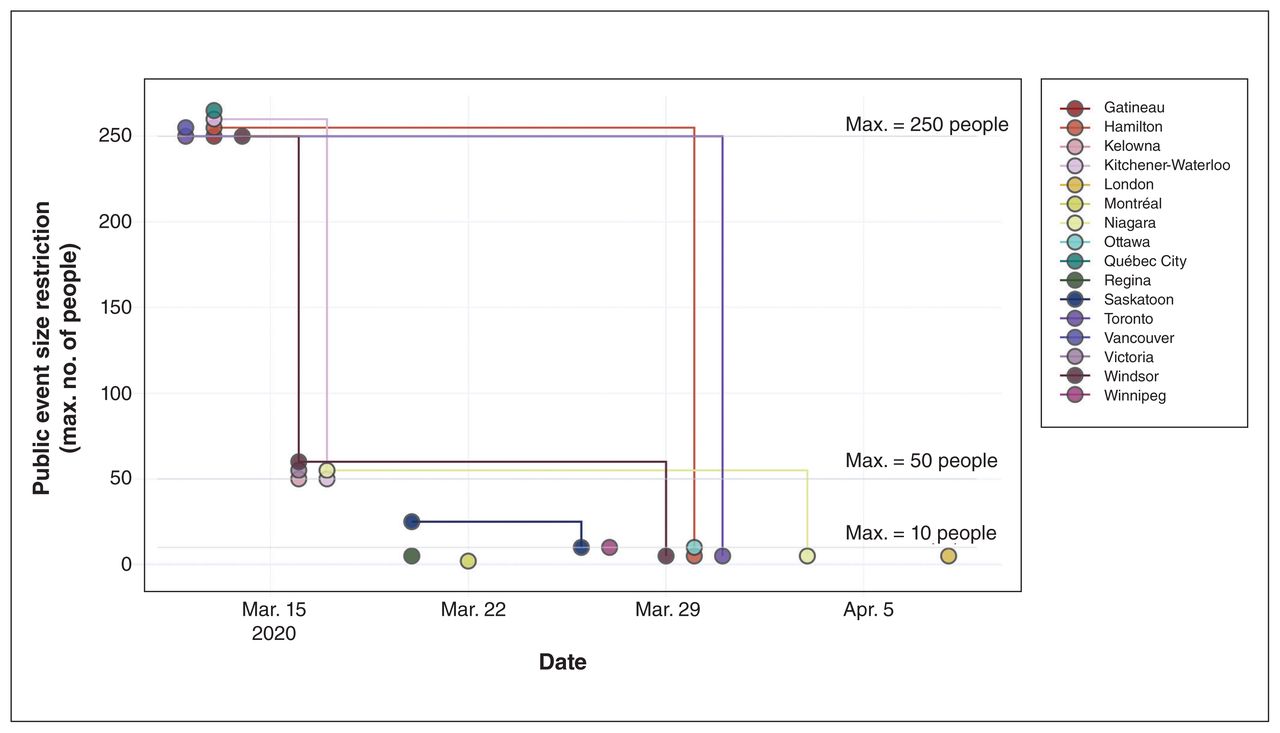
Public event size restrictions over time in Canada reported by census metropolitan area. Lines connect nonpharmaceutical interventions from the same municipality. Overlapping points indicate the same value as the lowest point. Census metropolitan areas that did not announce event size restrictions at the municipal level are excluded.
Interpretation
We present a comprehensive data set and descriptive analysis of NPIs implemented in Canada in the early response to COVID-19 at the federal, provincial or territorial, and municipal levels. We identified 2517 unique interventions implemented between Jan. 1 and Apr. 19, 2020, with temporal and spatial heterogeneity present among jurisdictions. Generally, all jurisdictions increased the stringency of their response after the WHO’s pandemic declaration on Mar. 11, 2020.11 British Columbia was the first province to act with a high degree of stringency and declare an outbreak, but in the following 3 weeks all other provinces and territories also increased their stringency. Declarations of states of emergency generally followed first case announcements and were implemented after school closures. Notably, all 3 territories declared a state of emergency before the first case announcement. There was also considerable variation at the municipal level in the number and timing of NPI announcements, but similarities in how they restricted the sizes of public events.
Although NPIs were implemented at different times across the world, the order of NPI implementation in Canada is similar to that found in other locations in Europe and Asia.12 With travel restrictions being among the first NPIs implemented at the national and territorial level, and school closures being among the most common NPI implemented at the provincial and municipal level. Similarly, NPI implementation was preemptive in smaller regions while implementation in urban hubs tended to occur in response to large increases in numbers of cases.12 Globally, NPI implementation, as measured by the OSI, increased after the WHO pandemic declaration,11 with rapid implementation of measures despite their high economic implications.8 This pattern was also reflected in Canada’s response overall, as its OSI8 rose rapidly following the WHO pandemic declaration.
Compared with state-level US literature, we found less provincial- and territorial-level variation in NPI implementation in Canada.13,14 In Canada, we consistently found that school closures were among the first NPIs implemented at the subnational level, which was either concurrent with, or closely followed by, declarations of states of emergency (with the notable exception of the territories, which declared states of emergency first). However, in the US, states tended to declare a state of emergency as their first NPI (a prerequisite to federal support under the Stafford Act15), and there was greater variance when states closed public schools.13 There was also variability in the implementation of measures to limit social gatherings, restrict nonessential businesses, and shelter-athome, all of which were NPIs that tended to be declared at later dates in the US.13
Although not explored here, there are numerous factors that may influence provincial or territorial and municipal implementation of NPIs. Research on these factors conducted in the US determined that dominant predictors of physical distancing policies were political, including the political party of a state’s governor and the concentration of partisan leaning within a state.14 A better understanding of these factors in Canada warrants further exploration.
There is also a growing body of literature evaluating the effect of NPIs using mathematical models2,4 as well as collating regional collections of NPIs in COVID-19 hotspots to interrogate their effectiveness.5,16,17 Where available, subnational NPI data sets have allowed for robust analyses, particularly when combined with case data and real-time mobility data.16,17 These linkages and analyses are needed both urgently as decision-makers are tasked with evaluating the impact of these NPIs in real time to inform Canada’s immediate pandemic response, and in the long term as retrospective work seeks to understand the nature of this response and how it may be improved for future outbreaks.7
Our study highlights the importance of NPIs to combat COVID-19 and shows that their rollout is fundamentally a local issue, in which decision-makers are best guided by data or circumstances specific to their own locale. Although the scope and scale of initiatives such as OxCGRT8 or the Assessment Capacities Project government measures data set9 is commendable, these data sets lack uniform granularity in subnational coverage (neither data set includes subnational entries for Canada at the time of writing). Thus, a strength in this work is its applicability to the Canadian context at both the national and subnational level.
Limitations
Owing to our reliance on public information to record NPIs, it is possible that interventions that were not publicly announced or covered by media outlets may have been omitted from our analysis. This may include interventions such as shifts in internal government or hospital procedures for testing and contact tracing. However, we expect that most interventions targeting the daily behaviour of Canadians will have been associated with public announcements. We also did not assess levels of compliance or the real-world implementation of these NPIs outside of government policy decisions.
There is also inherent variability in how different jurisdictions choose to report and describe their NPIs, as well as the range of information that is included. This may have introduced a degree of variability in our labelling, and thus, our analysis. We sought to minimize inconsistencies across jurisdictions and reviewers through our standardized onboarding process, stepwise data entry and a secondary, focused review by a subset of reviewers before conducting analysis.
Moreover, we do not aim to make any causal or associative conclusions around the impact of these NPIs and COVID-19 dynamics and burden in Canada in this first work, but this data set will enable this important future work by any researcher. Finally, the analyses in this paper account for changes in the first month after a global pandemic was declared using data available at the time of submission, with subsequent data included in the online data set but not within this paper.
Conclusion
Responsibility for implementing NPIs to control COVID-19 is shared among the federal, provincial or territorial, and municipal levels of government in Canada. Characterization of the subnational elements of response, however, is critical in guiding analysis of the effect of these NPIs on health outcomes. We have developed and released a comprehensive data set, CAN-NPI, including information about NPIs at all Canadian governmental levels, and derived insights related to the classes and temporal and spatial distribution of these NPIs early in the course of the pandemic. Further research to connect this work with additional data sources regarding the spread and economic impact of the pandemic is critical both to guide the ongoing policy response and to enable effective retrospective research to capture the impact of the COVID-19 pandemic in Canada.
Footnotes
Competing interests: None declared.
This article has been peer reviewed.
Contributors: Liam McCoy, Jonathan Smith and Benjamin Fine designed the study. Liam McCoy, Jonathan Smith, Kavya Anchuri, Isha Berry, Joanna Pineda, Vinyas Harish, Andrew Lam, Seung Eun Yi and Sophie Hu curated and extracted data. Jonathan Smith, Kavya Anchuri, Joanna Pineda and Seung Eun Yi conducted data analysis. All of the authors revised the manuscript critically for important intellectual content, gave final approval of the version to be published, and agreed to be accountable for all aspects of the work.
Funding: This work was supported by the Toronto COVID-19 Action Initiative from the University of Toronto. Laura Rosella is funded by a Canada Research Chair in Population Health Analytics. The funders had no role in the design and conduct of the study.
Data sharing: Our data set of Canadian non-pharmaceutical interventions is openly available to all under a CC BY 4.0 licence available at https://howsmyflattening.ca/#/data. All code used to generate the figures is available at https://github.com/jajsmith/cannpi-cmaj.
Members of the COVID-19 Canada Open Data Working Group: Non-Pharmaceutical Interventions: Maya Abdalla, Tasnim Abdalla, Edem A. Afenu, Kavya Anchuri, Shimi Afhami, Jason Baek, Benjamin Baker, Vishali Balasubramaniam, Isha Berry, Holly Burrows, Yuri Chaban, Jenelle Chen, Joseph Chon, Ryan Daniel, Kristen Dietrich, Nick Fernandez, Hilary Anya Friesen, Sarah Giacobbo, Vinyas Harish, Mary Hou, Sophie Hu, Joseph Jamnik, Mona Khalid, Valerie Kim, Andrew Lam, Haoyue Helena Lan, Kris Lautens, Margot Lautens, Daniel Lazzam, Liam G. McCoy, Victoria Mintsopoulos, Nykan Mirchi, Ngoc Son Nguyen, Salmi Noor, Joanna Pineda, Laura Rivera, Jayoti Rana, Saad Shakeel, Amrit Sampalli, James Saravanamuttu, Tejeswin Sharma, Jonathan Smith, Jacqui van Warmerdam, Kay Wu, Arnold Yeung, Seung Eun Yi, Jennifer Zheng
Note: An early version of this paper was posted on MedrXiv on Apr. 22, 2020 (https://doi.org/10.1101/2020.04.17.20068460).
Supplemental information: For reviewer comments and the original submission of this manuscript, please see www.cmajopen.ca/content/8/3/E545/suppl/DC1.
References
- Copyright 2020, Joule Inc. or its licensors
In this issue

Article tools


Related Articles
Cited By...
- Is SARS-CoV-2 elimination or mitigation best? Regional and disease characteristics determine the recommended strategy
- How Canadas decentralised covid-19 response affected public health data and decision making
- Assessing the potential impact of immunity waning on the dynamics of COVID-19: an endemic model of COVID-19
- A partisan pandemic: state government public health policies to combat COVID-19 in Brazil
- Modeling the Effect of Population-Wide Vaccination on the Evolution of COVID-19 Epidemic in Canada
- Public health measures to reduce the risk of SARS-CoV-2 transmission in Canada during the early days of the COVID-19 pandemic: a scoping review