


Abstract
Background: Chronic diseases may increase risk of infection and complications from infections; fear of these risks may lower clinicians’ tolerance threshold for the prescription of antimicrobials, thus increasing the risk of selecting resistant bacteria. We sought to describe rates of antimicrobial use in Quebec and measure the association between chronic diseases and utilization rates.
Methods: Using the Quebec Integrated Chronic Disease Surveillance System, we analyzed data of people covered by the public drug insurance plan in 2002–2017. Based on delivered prescriptions, we described trends in antimicrobial use in the population, and per category of select chronic diseases (i.e., none, respiratory, cardiovascular, diabetes, mental disorder), according to age group (0–17 yr, 18–64 yr and ≥ 65 yr). We computed ratios of extended-to-narrow–spectrum antimicrobials in 2014–2017. We used robust Poisson regression to quantify the association between chronic diseases and rates of antimicrobial use among children and adults (≥ 18 yr).
Results: Between 2002 and 2017, 4 231 724 prescriptions were received over 6 653 473 individual-years among children; 1 367 492 (20.6%) individual-years had at least 1 chronic disease. Among adults aged 18–64 years, 13 365 577 prescriptions were received over 24 935 592 individual-years; 9 533 493 (38.2%) individual-years had at least 1 chronic disease. Among adults 65 years or older, 11 689 365 prescriptions were received over 15 927 342 individual-years; 12 743 588 (80.0%) individual-years had least 1 chronic disease. Antimicrobial use decreased among children, remained stable among younger adults and increased among older adults. Trends were consistent across chronic disease categories in children and older adults. In 2014–2017, 19.9% of children, 39.1% of younger adults and 79.7% of older adults had at least 1 chronic disease. Claims for extended-spectrum antimicrobials were frequent in all age and chronic disease groups, relative to narrow-spectrum antimicrobials (ratios from 3.1:1 to 14.6:1). Antimicrobial use was higher among people with respiratory diseases (adults: relative rate [RR] 2.09, 95% confidence interval [CI] 2.07–2.10; children: RR 1.62, 95% CI 1.59–1.65), mental health diagnoses (adults: RR 1.48, 95% CI 1.46–1.49; children: RR 1.22, 95% 1.20–1.24), diabetes (adults: RR 1.40, 95% CI 1.28–1.41; children: RR 2.02, 95% CI 1.58–2.57) and cardiovascular diseases (adults: RR 1.31, 95% CI 1.30–1.32), compared with those with none of the studied chronic diseases.
Interpretation: During the study period, large proportions of antimicrobial prescriptions were for people with chronic diseases, across the age spectrum. Interventions to reduce antimicrobial use should be tailored for these populations.
The World Health Organization (WHO) released its Global Strategy for Containment of Antimicrobial Resistance in 2001, recommending that governments and health systems perform surveillance of antimicrobial usage.1 By measuring levels of antimicrobials used, surveillance allows comparisons within jurisdictions (in time) and between jurisdictions, with the aim of identifying unusual situations and to determine whether public health interventions or clinical adjustments are needed. However, although antimicrobial use is associated with the incidence of infections in a population, it can also reflect the population’s general health status. In particular, chronic diseases may increase an individual’s risk of infections and complications from infections; indirectly, the fear of complications can also lower a clinician’s tolerance threshold before prescribing antimicrobials.2–8 Hence, for a given population, the proportion of total antimicrobial use that can be reduced and the strategies to improve antimicrobial use depend, in part, on the prevalence of chronic diseases.
The Canadian Antimicrobial Resistance Surveillance System monitors antimicrobial use in humans; it shows important variations across provinces despite the low granularity of data, but it does not provide any insight on the potential role of chronic diseases.9 Although there is no provincial surveillance of community (i.e., out of hospital) antimicrobial use among all residents of Quebec, the Quebec Integrated Chronic Disease Surveillance System (QICDSS) performs surveillance of chronic diseases and of associated drug prescriptions for people covered by the public drug insurance plan (46% of the province’s population).10,11 Aiming to identify populations for targeted antimicrobial stewardship in the Quebec population, and using data from this system, we sought to describe community antibiotic use in the population of Quebec, from 2002 to 2017, overall and according to different categories of chronic diseases, and to estimate the magnitude of the difference in antimicrobial use associated with these diseases in more recent years (2014–2017).
Methods
Study design
We conducted a retrospective, population-based analysis of administrative data routinely collected by the Government of Quebec, Canada. We followed the Reporting of Studies Conducted Using Observational Routinely-Collected Health Data (RECORD) extension to the Strengthening the Reporting of Observational Studies in Epidemiology (STROBE) guidelines and report our work accordingly.12
Setting and study population
We included all individuals covered for at least 1 day by Quebec’s provincial drug insurance plan, the Régie de l’assurance maladie du Québec (RAMQ), according to the health insurance registry, between Apr. 1, 2002, and Mar. 31, 2017. In 2016, these individuals represented 27.4% of all children, 34.2% of adults aged 18–64 years and 89.6% of adults aged 65 years or older.13 Although coverage is offered to all older adults, it is restricted to people without access to a private insurance in other age groups (i.e., those who are self-employed or benefitting from social assistance). Residents in long-term care facilities are not covered by the provincial drug insurance and were excluded. We included people only for the period during which they were covered by provincial drug insurance, measured in days. Quebec has a population of around 8 200 000 inhabitants and has a public health system accessible to all.13
Data sources and variables
The QICDSS and methods for the computation of rates of antimicrobial use have already been described in detail elsewhere. 10 Using a unique identifier, the QICDSS links information from 5 administrative health databases, as follows: the health insurance registry (Fichier d’inscription des personnes assurées), the hospital admission and discharge database (Maintenance et exploitation des données pour l’étude de la clientèle hospitalière), the vital statistics death database, the physician claims database and the pharmaceutical services database. Duplicates are removed. The presence of various chronic diseases is identified using validated algorithms developed specifically for administrative health databases (Appendix 1, available at www.cmajopen.ca/content/10/3/E831/suppl/DC1).10
For the purposes of this study, our team selected the most frequent chronic diseases that are the subject of surveillance in the QICDSS, and grouped them into the following 5 categories based on diagnostic codes in medical claims and hospital admissions data, and on drugs served in pharmaceutical claims data (codes are listed in Appendix 1): respiratory diseases (i.e., asthma or chronic obstructive pulmonary diseases [COPDs]), diabetes, cardiovascular diseases (i.e., hypertension, heart failure and ischemic heart disease), mental health diagnoses (e.g., attention-deficit/hyperactivity disorder, schizophrenia, anxiety disorders, Alzheimer disease) or none of these chronic diseases. We reassessed the presence of chronic diseases every year for included individuals in the study, which allowed the identification of mental disorders, most of which require annual validation. Other chronic diseases are considered life-time prevalent once the algorithm-validated diagnosis is recorded in the QICDSS). An individual could have more than 1 of the studied chronic diseases.
We measured antibiotic use in prescriptions per 1000 individual-years and, for oral prescriptions for adults, in defined daily doses per 1000 individual-days (DIDs). We combined information in the pharmaceutical services database (common denomination codes used in the RAMQ to identify the drug used) to identify antimicrobial prescriptions and total quantity served), on the WHO Collaborating Centre for Drug Statistics Methodology website (to attribute antimicrobial class and defined daily doses to each prescription) and on the Drug Product Database online query website.14–16 We could not compute defined daily doses for parenteral prescriptions (2.0% of community antimicrobial use; unpublished data, 2022) or for children, because pediatric dosages are based on the child’s weight, while standard defined daily doses are based on doses commonly prescribed to 70 kg adults.14 We selected antimicrobials for systemic use as listed in class J01 of the Anatomic Therapeutic Chemical classification (see the corresponding common denomination codes used in our data in Appendix 2, available at www.cmajopen.ca/content/10/3/E831/suppl/DC1).14 We grouped them by ATC classification, as follows: tetracyclines, amphenicols, β-lactamase–resistant penicillins, β-lactamase–sensitive penicillins, penicillins with extended spectrum, penicillins and enzyme inhibitors, first-generation cephalosporins, second-generation cephalosporins, third-generation cephalosporins, fourth-generation cephalosporins, carbapenems, sulfonamides and trimethoprim, aminoglycosides, fluoroquinolones, other quinolones, glycopeptides, lincosamides, macrolides, monobactams, polymyxins, streptogramins and other antibacterials.
We computed rates of antimicrobial use per antimicrobial class and per antimicrobial. We also stratified rates per chronic disease category, age group (based on age on Oct. 1 of each year), sex, region, and quintiles of social and material deprivation indices (based on validated algorithms developed by the Institut national de santé publique du Québec and measured at the neighbourhood level).17 We collected demographic information from the health insurance registry. We excluded observations with missing values for region, age, sex or year from the analyses.
Statistical analysis
We conducted a time-series analysis, representing the evolution of the use of main antimicrobial classes from 2002 to 2017, stratified by category of chronic disease and by age group. We also computed the distribution of antimicrobials prescribed from April 2014 to March 2017 for each category of chronic diseases, as well as the ratio of extended-spectrum (i.e., penicillins and cephalosporins, nonerythromycin macrolides and lincosamides) to narrow-spectrum antimicrobials (i.e., penicillin G, penicillin V, cefadroxil, cephalexin, cefazolin, cloxacillin and erythromycin). Kristensen and colleagues18 used this ratio to detect differences in the use of antimicrobials that tend to favour the selection of resistant strains (extended-spectrum antimicrobials) and those that minimize this selection (narrow-spectrum antimicrobials).18 We used robust Poisson regression to measure the association between categories of chronic diseases and rates of total antimicrobial use from April 2014 to March 2017, using generalized estimating equations with an exchangeable correlation structure to account for within-person correlation among individuals who contributed observations from multiple years. We restricted ratio computations and regression analyses to 2014–2017 data to describe the recent years of the study population; this also had the advantage of preventing biased results arising from changes in coding practices (i.e., identification of chronic diseases). All categories of chronic diseases were systematically included in the models (even for crude rate ratios computations), meaning that rate ratios were adjusted for the presence of other chronic diseases, as there was a dummy variable for each chronic disease. Rate ratios measuring the association between chronic diseases and utilization were adjusted only for covariables that changed regression coefficients by at least 5% for at least 1 of the categories of chronic diseases (age group in children, and sex and age group in adults). Although we stratified all other analyses for each of the 3 age groups, we performed regressions on only 2 age groups (adults and children). The adjustment by age group made it possible to include all adults (≥ 18 yr) in the same models to obtain an average effect. We kept children in a separate model because fewer chronic diseases are monitored in the QICDSS for this age group.
Ethics approval
The use of QICDSS for surveillance purposes has been approved by the government bodies, the Public Heath Ethics Committee and the Commission d’accès à l’information du Québec.10 The first author had access to depersonalized QICDSS data with support from a senior statistician (M.S.).
Results
Antimicrobial use per category of chronic diseases (2002–2017)
Between Apr. 1, 2002, and Mar. 31, 2017, 4 231 724 prescriptions were received over 6 653 473 individual-years among children; 1 367 492 (20.6%) individual-years had at least 1 chronic disease. Among adults aged 18–64 years, 13 365 577 prescriptions were received over 24 935 592 individual-years; 9 533 493 (38.2%) individual-years had at least 1 chronic disease. Among adults 65 years or older, 11 689 365 prescriptions were received over 15 927 342 individual-years; 12 743 588 (80.0%) individual-years had least 1 chronic disease.
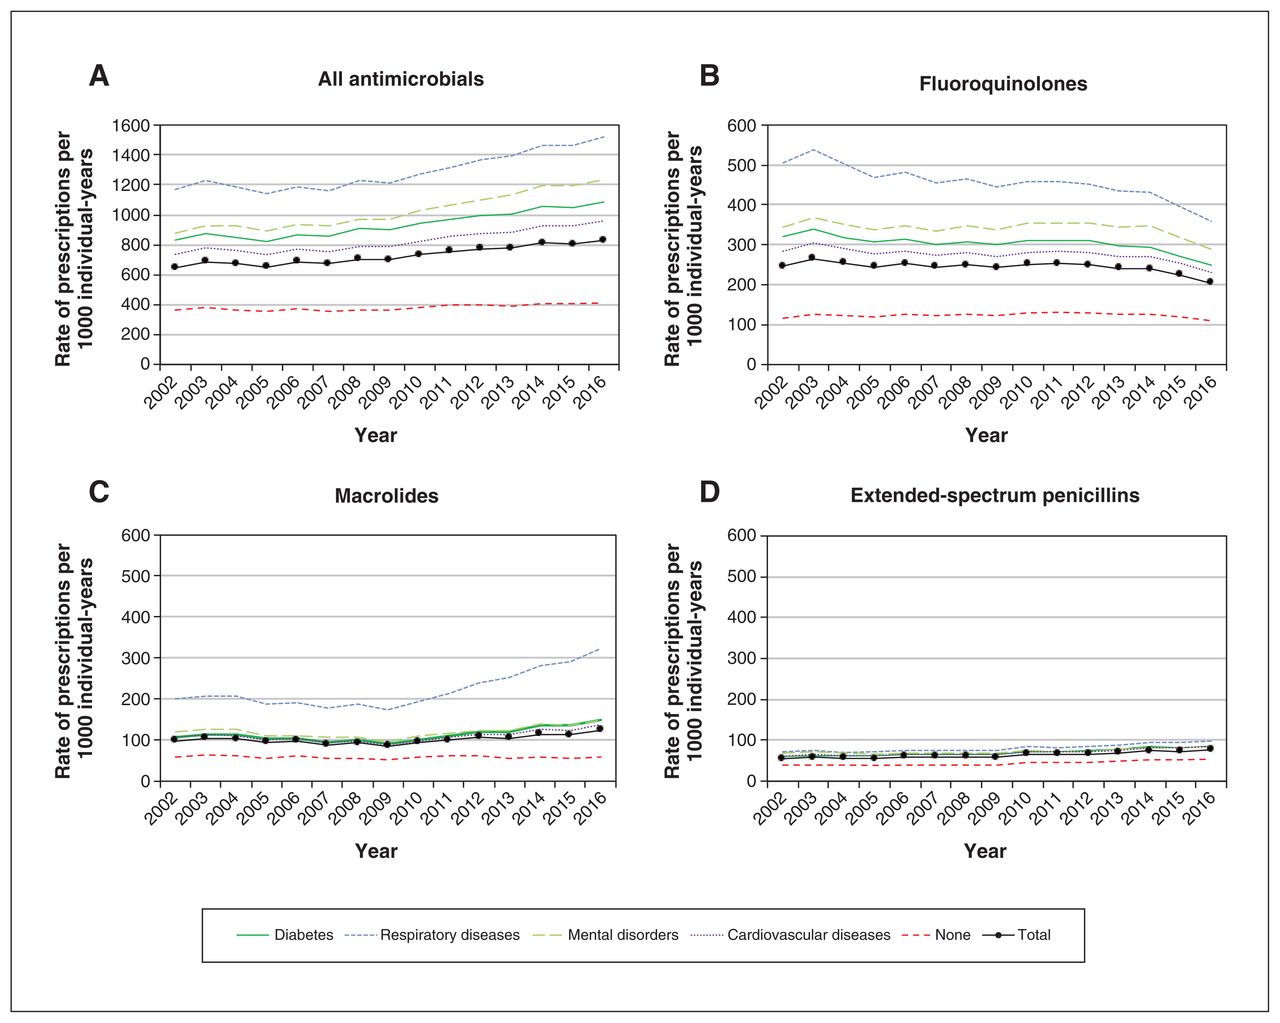
Overall, antimicrobial use decreased among children (Figure 1), remained stable among younger adults (Figure 2) and increased among older adults (Figure 3). For all age groups, antimicrobial use was systematically lower among people without a chronic disease. For children (Figure 1), total use was driven by extended-spectrum penicillins, macrolides and second-generation cephalosporins. Total use decreased by 36.9% between 2002 and 2013, going from 853 to 538 prescriptions per 1000 individual-years, then it remained stable. In the group of younger adults (18–64 yr, Figure 2), total use was driven by fluoroquinolones, macrolides and extended-spectrum penicillins, and remained stable throughout the study period (540 prescriptions per 1000 individual-years in 2002 v. 542 per 1000 individual-years in 2017). Total use decreased among people with chronic respiratory diseases and increased among people with cardiovascular diseases or diabetes. Finally, among adults aged 65 years and older, total antimicrobial use was mainly influenced by fluoroquinolones, macrolides and extended-spectrum penicillins. Total use gradually increased over the observation period, from 645 to 829 prescriptions per 1000 individual-years (Figure 3); we observed an 85.7% increase in macrolide use among people with respiratory diseases between 2009 (174 prescriptions per 1000 individual-years) and 2017 (323 prescriptions per 1000 individual-years).
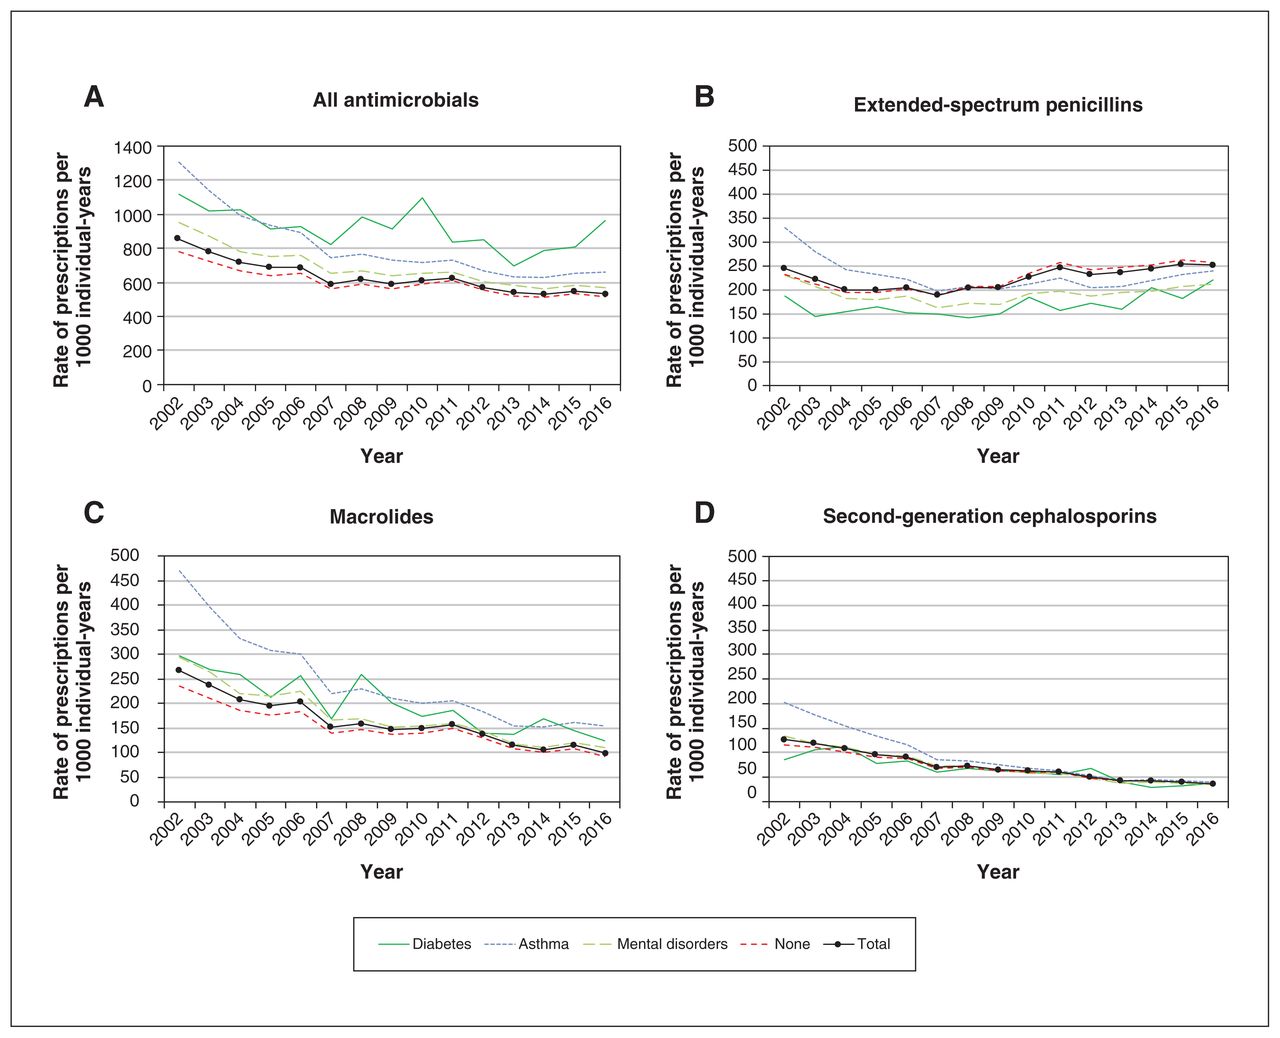
Evolution of rates of (A) all antimicrobial use, (B) use of extended-spectrum penicillins, (C) use of macrolides and (D) use of second-generation cephalosporins among children between April 2002 and March 2017, by chronic disease category. Mental disorders include many different disorders (e.g., attention-deficit/hyperactivity disorder, schizophrenia, anxiety disorders, Alzheimer disease). “No chronic diseases” means that none of the other categories of chronic diseases are present. Individuals with more than 1 chronic disease were included in all the relevant categories of chronic diseases; consequently, the total values are not equal to the sum of the values for each category of chronic diseases.

Evolution of rates of (A) all antimicrobial use, (B) use of fluoroquinolones, (C) use of macrolides and (D) use of extended-spectrum penicillins among adults aged 18–64 years, between April 2002 and March 2017, by chronic disease category. Respiratory diseases include asthma or chronic obstructive pulmonary diseases. Cardiovascular diseases include hypertension, heart failure and ischemic heart disease. Mental disorders include many different disorders (e.g., attention-deficit/hyperactivity disorder, schizophrenia, anxiety disorders, Alzheimer disease). “None” means that none of the other categories of chronic diseases are present. Individuals with more than 1 chronic disease were included in all the relevant categories of chronic diseases; consequently, the total values are not equal to the sum of the values for each category of chronic diseases.

Evolution of rates of (A) all antimicrobial use, (B) use of fluoroquinolones, (C) use of macrolides and (D) use of extended-spectrum penicillins among adults aged 65 years and older, between April 2002 and March 2017, by chronic disease category. Respiratory diseases include asthma or chronic obstructive pulmonary diseases. Cardiovascular diseases include hypertension, heart failure and ischemic heart disease. Mental disorders include many different disorders (e.g., attention-deficit/hyperactivity disorder, schizophrenia, anxiety disorders, Alzheimer disease). “None” means that none of the other categories of chronic diseases are present. Individuals with more than 1 chronic disease were included in all the relevant categories of chronic diseases; consequently, the total values are not equal to the sum of the values for each category of chronic diseases.
Chronic diseases and antimicrobial use (2014–2017)
The 2014–2017 demographics of the 3 age groups are described in Appendix 3, available at www.cmajopen.ca/content/10/3/E831/suppl/DC1. Region, age, sex or year were missing for less than 0.4% of individuals. Quintiles of social and material deprivation could not be attributed to 6.5% of individuals, who were treated as a separate category. The choice of antimicrobials varied according to chronic diseases categories (Table 1). Adults (239.8 and 302.93 prescriptions per 1000 individual-years among younger and older adults, respectively) had lower rates of extended-spectrum antimicrobial use than children (455.7 prescriptions per 1000 individual-years), with the exception of adults aged 65 years and older with a respiratory disease (623.4 prescriptions per 1000 individual-years). Ratios of extended-to-narrow–spectrum antimicrobials were also lower in adults (3.4 in younger adults and 4.0 in older adults) than in children (13.3). Although the ratio was higher in adults with respiratory diseases (4.8 in younger adults and 5.9 in older adults) than in other adults, the highest ratio in children was observed in the largest group, namely children with no chronic disease (14.6).
Unadjusted rates of antimicrobial use, and ratios of extended-to-narrow–spectrum antimicrobials, per age group and category of chronic disease, April 2014 to March 2017
In our study, 251 321 (19.9%) of 1 259 833 individual-years among children, 2 072 617 (39.2%) of 5 281 026 individual-years among younger adults and 3 073 175 (80.0%) of 3 841 359 individual-years among older adults had at least 1 chronic disease. Total pediatric antimicrobial use was 538.0 prescriptions per 1000 individual-years (Table 1), but it increased among people with diabetes (increase of 101.7%), asthma (increase of 61.7%) and mental health diagnoses (increase of 22.2%), after adjustment for age (Table 2), compared with those with none of the studied chronic diseases. Total antimicrobial use was 539.7 and 814.6 prescriptions per 1000 individual-years (12.3 DID and 16.0 DID) among younger and older adults, respectively (Table 1). Results of regressions on adult antimicrobial use data show that adults with chronic respiratory diseases were exposed to antimicrobials twice as much as those without chronic diseases (increase of 108.6%), after adjustment for age and sex (Table 2). Other chronic diseases were also associated with a higher antimicrobial use, but to a lesser extent, with an increase of 47.8% in the presence of a mental disorder, 39.7% for diabetes and 31.4% for cardiovascular diseases. Results were similar when modelling antimicrobial use in DID, but the effect was smaller for mental disorders and diabetes, with increases of 23.6% and 27.0%, respectively.
Relative rates of antimicrobial use among children (0–17 yr) and adults (≥ 18 yr) according to category of chronic disease, age and sex, April 2014 to March 2017
Interpretation
In Quebec, between 2002 and 2017, the crude rate of prescriptions per 1000 individual-years decreased among children, remained stable among younger adults and increased among older adults, especially for those with chronic respiratory diseases. Antimicrobial use was systematically higher in subpopulations with cardiovascular diseases, respiratory diseases, diabetes or mental disorders than those with no chronic diseases. Extended-spectrum antimicrobials were prescribed 3–15 times more frequently than narrow-spectrum antimicrobials, depending on age group and chronic disease.
In the province of Quebec, the first clinical guideline for antimicrobial therapy was published in 2005 and was updated in October 2009 and 2016–2017, but there is currently no ongoing provincial surveillance of antimicrobial use in the community.19,20 We observed an increase in use of macrolides and extended-spectrum penicillin among people aged 65 years or older. As studied previously, the increase in macrolide use was driven by the use of azithromycin, which became more popular in the treatment of COPD exacerbations despite hesitations in issuing recommendations, given the threat of selecting resistant bacteria.4–6,14 In 2009, amoxicillin appeared for the first time in guidelines for the treatment of community-acquired pneumonia, which may have contributed to the observed increased use of extended-spectrum penicillin among people aged 65 years or over, but was not observed among younger adults.21,22 We did not have data on treatment indications and, therefore, cannot validate this hypothesis.
Antimicrobial use was consistently higher among people with chronic diseases in all age groups, despite different time trends across age groups. The proportion of people with at least 1 chronic disease increased by 4.3% and 3.8% among younger and older adults, respectively, between 2002 and 2017, but remained stable among children. Despite this, antimicrobial use decreased among children, remained stable among younger adults and increased among adults aged 65 years or older. Our time trends show the evolution of exposure to antimicrobials in the population, which is important for the control of antimicrobial resistance, but different analyses would be necessary to support changes in prescribing practices (e.g., stratification or adjustment for age, sex, treatment indication and chronic diseases).
Quebec’s rates of antimicrobial use are among the lowest in Canada (16.2 DID v. 17.5 DID for the entire country, in 2018).9 However, in 2019, the Netherlands (8.7 DID) had the lowest rate in Europe and Norway had the lowest ratio of broad-to-narrow-spectrum antimicrobials (0.15).23,24 Although these estimates include pediatric use, they are much lower than the 2014–2017 rates (12.3 and 16.0 DID in younger and older adults, respectively) and ratios (5.9 in younger adults and 6.9 in older adults) in Quebec. This suggests that Quebec’s antimicrobial use may still be improved. However, rates of antimicrobial use do not inform on the appropriateness of prescriptions, and crude statistics (i.e., no adjustment for age, sex and chronic diseases) further complicate international comparisons. It is possible that clinicians prescribe antimicrobials more frequently for patients with chronic diseases to prevent complications of infections in already vulnerable individuals.
The association between chronic disease and antimicrobial use observed in this study is similar to results from other studies. The increased use of antimicrobials among people with chronic respiratory diseases is well known. In British and Danish children, antimicrobial use was 1.6 times higher among children with asthma than among those without asthma, identical to our estimate of 1.6.2 A British study with a similar study design to ours observed that antimicrobial use among adults was 3.0 times higher in the presence of COPD and 1.6 times higher in cases of asthma.3 Our estimate, including patients with COPD or asthma, was 2.1. Other chronic diseases are also associated with increased antimicrobial use. An Australian study reported 1.3 times more antimicrobial treatments against influenza-like illnesses among patients with any chronic disease compared with patients without such a disease.7 A British study also reported increases in antimicrobial use ranging between 40% and 70% among adults with diabetes or cardiovascular diseases; our own estimates varied between 31% and 40%.3 An explanation for this increase could relate to the process leading to the diagnosis of asthma, COPD or heart failure, given that antimicrobial use was higher in the 3 months preceding diagnosis, but returned to normal after the diagnosis.8 Finally, ratios of extended-to-narrow–spectrum antimicrobials suggest that chronic diseases, especially chronic respiratory diseases, also influence the choice of the agent, possibly to prevent complications and interactions with drugs prescribed for the treatment of chronic diseases.24
Limitations
Because the coverage offered by the public drug insurance excludes people younger than 65 years who can access a private insurance, our study population is not representative of the general population. For instance, people with chronic disease and those of lower socioeconomic status may be over-represented in this study compared with the general population, influencing unadjusted global results. However, a comparison of our data with IQVIA data (which include 97% of Quebec’s community pharmacies) showed that rates of prescriptions per 1000 individual-years were almost equal after adjustment for age.25 Still, we used prescriptions as a proxy for use, as is often the case in similar studies, and cannot measure how frequently antibiotics delivered by local pharmacies are actually used by patients. Another potential limitation to our results was that we counted the number of acts performed by community pharmacists, meaning that treatments split into 2 pillboxes count as 2 prescriptions. People with chronic diseases, and thus complex therapies, are more likely to use pillboxes. As our results were similar for rates in DID and rates in prescriptions per 1000 individual-years, we are reassured that this bias does not compromise the validity of our conclusions. In addition, QICDSS uses validated algorithms to identify people with certain chronic diseases, but other chronic diseases with a suspected impact on antimicrobial use are not monitored, such as renal failure, cystic fibrosis and diseases leading to immunosuppression.3 Therefore, the “no chronic disease” group will include some people with other chronic diseases, potentially attenuating differences from the other chronic disease groups represented in analyses. Changes in consultation habits and diagnostic coding preferences over time may have affected categories of chronic diseases despite applying the same algorithms for the entire study period; this is why we limited some analyses to the last 3 years of the study period. Also, the stage of chronic diseases is not documented in the QICDSS; had it been accounted for in our analyses, the associations for advanced chronic diseases would probably have been larger than the average estimates presented here.8 Finally, as for any observational study, and especially given the limited available covariables, residual confounding is still possible.
Conclusion
The rates of antimicrobial use in Quebec are relatively low and a very large proportion of prescribed quantities are for individuals with at least 1 chronic disease, who receive more antimicrobial prescriptions than people without chronic diseases. This raises the question of whether antimicrobial use can be reduced or improved to limit the selection of resistant bacteria, especially when chronic diseases further complicate the choice of antimicrobial treatment. We could not distinguish between justified use and use that was a precaution, but given the magnitude of the difference between people with and without chronic diseases, interventions targeting use of antimicrobials as a precaution may have an important impact on rates of antimicrobial use among people with chronic diseases. This question should be investigated.
Footnotes
Competing interests: None declared.
This article has been peer reviewed.
Contributors: Élise Fortin, Caroline Sirois, Caroline Quach, Sonia Jean and Marc Simard conceived and designed the study. All of the authors contributed to the acquisition, analysis and interpretation of data. All of the authors drafted the manuscript, revised it critically for important intellectual content, gave final approval of the version to be published and agreed to be accountable for all aspects of the work.
Funding: This work was supported by the Ministère de la santé et des services sociaux du Québec. Publication in this journal was supported by a dissemination grant from the Canadian Institutes of Health Research (Institute of Infection and Immunity). Caroline Sirois was supported by the Fonds de recherche du Québec. Caroline Quach was supported by a Tier 1 Canada Research Chair in infection prevention.
Data sharing: Data used for this study cannot be shared. Any questions can be addressed to the corresponding author.
Supplemental information: For reviewer comments and the original submission of this manuscript, please see www.cmajopen.ca/content/10/3/E831/suppl/DC1.
This is an Open Access article distributed in accordance with the terms of the Creative Commons Attribution (CC BY-NC-ND 4.0) licence, which permits use, distribution and reproduction in any medium, provided that the original publication is properly cited, the use is noncommercial (i.e., research or educational use), and no modifications or adaptations are made. See: https://creativecommons.org/licenses/by-nc-nd/4.0/
References
- © 2022 CMA Impact Inc. or its licensors
In this issue

Article tools


Related Articles
Cited By...
- Population-based outpatient antimicrobial use in Newfoundland and Labrador: a retrospective descriptive study
- Chronic diseases and compliance with provincial guidelines for outpatient antibiotic prescription in cases of otitis media and respiratory infections: a population-based study of linked data in Quebec, Canada, 2010-2017