


Abstract
Background: A bidirectional association between depression and diabetes exists, but has not been evaluated in the context of immigrant status. Given that social determinants of health differ between immigrants and nonimmigrants, we evaluated the association between diabetes and depression incidence, depression and diabetes incidence, and whether immigrant status modified this association, among immigrants and nonimmigrants in Canada.
Methods: We employed a retrospective cohort design using data from the Canadian Longitudinal Study on Aging Comprehensive cohort (baseline [2012–2015] and 3-year follow-up [2015–2018]). We defined participants as having diabetes if they self-reported it or if their glycated hemoglobin A1c level was 7% or more; we defined participants as having depression if their Center for Epidemiological Studies Depression score was 10 or higher or if they were currently undergoing depression treatment. We excluded those with baseline depression (Cohort 1) and baseline diabetes (Cohort 2) to evaluate the associations between diabetes and depression incidence, and between depression and diabetes incidence, respectively. We constructed logistic regression models with interaction by immigrant status.
Results: Cohort 1 (n = 20 723; mean age 62.7 yr, standard deviation [SD] 10.1 yr; 47.6% female) included 3766 (18.2%) immigrants. Among immigrants, 16.4% had diabetes, compared with 15.6% among nonimmigrants. Diabetes was associated with an increased risk of depression in nonimmigrants (adjusted odds ratio [OR] 1.27, 95% confidence interval [CI] 1.08–1.49), but not in immigrants (adjusted OR 1.12, 95% CI 0.80–1.56). Younger age, female sex, weight change, poor sleep quality and pain increased depression risk. Cohort 2 (n = 22 054; mean age 62.1 yr, SD 10.1 yr; 52.2% female) included 3913 (17.7%) immigrants. Depression was associated with an increased risk of diabetes in both nonimmigrants (adjusted OR 1.39, 95% CI 1.16–1.68) and immigrants (adjusted OR 1.60, 95% CI 1.08–2.37). Younger age, male sex, waist circumference, weight change, hypertension and heart disease increased diabetes risk.
Interpretation: We found an overall bidirectional association between diabetes and depression that was not significantly modified by immigrant status. Screening for diabetes for people with depression and screening for depression for those with diabetes should be considered.
Screening for diabetes and depression is recommended in recently arrived immigrants.1 In addition, given some evidence for a bidirectional association between diabetes and depression in the general population,2–5 ongoing surveillance for diabetes may be relevant in the context of depression and, likewise, ongoing surveillance for depression may be justified with people with diabetes, particularly among immigrants.
Immigrants may be particularly vulnerable to the development of diabetes and depression6–9 owing to factors associated with resettlement, such as acculturation, stress and social and economic challenges.5,10–17 For example, studies have reported that immigrants from South Asian countries are generally healthy upon arrival but rapidly develop diabetes after immigration.18,19 Studies have also reported that immigrants with diabetes are at higher risk of depression than the general host population6,7 and the population in their country of origin.12,20–25 Conversely, immigrants with depression may also be at high risk of diabetes because of complex social determinants of health1,18,19,26 and delayed diagnosis of and treatment for diabetes;27–31 use of antidepressants may also increase diabetes risk.32,33
To explore the bidirectional association between diabetes and depression in the context of immigrant status, we evaluated the association between diabetes and depression incidence, the association between depression and diabetes incidence, and whether immigration status modified this association, among immigrants and nonimmigrants in Canada.
Methods
Study design
We used a retrospective cohort design to evaluate the association between diabetes and depression incidence (Cohort 1) and the association between depression and diabetes incidence (Cohort 2).
We used data from the Canadian Longitudinal Study on Aging (CLSA) Comprehensive cohort at baseline (2012–2015) and 3-year follow-up (2015–2018) to construct our study cohorts.34,35 The paper was reported according to the Strengthening the Reporting of Observational Studies in Epidemiology (STROBE) checklist.36
Data source and population
The CLSA Comprehensive cohort included community-dwelling individuals, aged 45–85 years, who were randomly selected from within a 25-km radius of 11 sites in cities across Canada using the provincial health care registration databases and random digit dialing of landline telephones.34 Participants provided demographic, social, physical, clinical, psychological and economic data at baseline and at 3-year follow-up through an in-person interview, on-site physical examinations and blood and urine collection. Details about the CLSA’s sampling, design and data collection have been published.34,35
We defined participants as having diabetes if they self-reported a diagnosis with any type of diabetes (i.e., answered yes to “Has a doctor ever told you that you have diabetes, borderline diabetes or that your blood sugar is high?”) or if their glycated hemoglobin (HbA1c) level was 7% or more. We defined participants as having depression if their Center for Epidemiological Studies Depression-10 Scale (CES-D-10) score was 10 or higher or if they self-reported being currently treated for depression.37–40 For both Cohort 1 and Cohort 2, we excluded participants missing information on immigration, depression or diabetes at baseline. In addition, for Cohort 1, we excluded those with baseline depression and those with missing depression status in follow-up; for Cohort 2, we excluded those with baseline diabetes and those with missing diabetes status in follow-up. The CLSA defined immigrants using 2 questions: “In what country were you born?” and “In what year did you first come to Canada to live?”41
Exposure and outcomes
Our outcomes were depression incidence for Cohort 1 and diabetes incidence for Cohort 2, assessed using the 3-year follow-up data. Depression was defined the same at follow-up as at baseline, but diabetes in follow-up was based only on self-report because HbA1c data were unavailable at that time point. The main exposure variables were baseline diabetes for Cohort 1 and baseline depression for Cohort 2.
Baseline characteristics
The baseline characteristics for Cohort 1 and Cohort 2 included those previously associated with both diabetes and depression, namely self-reported predisposing sociodemographic and socioeconomic factors, medical conditions and lifestyle choices, as well as anthropomorphic measurements and blood assessments. The predisposing sociodemographic and socioeconomic factors included sex, age, ethnic or racial background, immigration status, time since migration, marital status, language most spoken at home, household income, employment status, education, province and place of residence. The place of residence classification (urban or rural) was derived by the CLSA based on Statistics Canada’s Postal Code Conversion File, whereby rural areas were those with a total population of fewer than 10 000 people.42 The medical conditions included pain,43 cancer,44 arthritis,45 bowel disorders46 and hypertension.47 The lifestyle choices included perceived health, sleep satisfaction, alcohol consumption, smoking status and nutritional risk. The anthropomorphic measurements and blood assessments included body mass index, waist circumference, 48 weight change49 and vitamin D deficiency.50,51 Details on these baseline characteristics are provided in Appendix 1, available at www.cmajopen.ca/content/10/2/E508/suppl/DC1.
In addition, we assessed self-reported comorbidities associated with depression, including heart disease,52,53 kidney disease54 and iron deficiency,50,51,55 for Cohort 1; we considered participant lipid profiles (assessed from blood tests)56 and lean and fat mass (measured with dual-energy x-ray absorptiometry) 57 for Cohort 2.
Statistical analysis
For each cohort, we computed descriptive statistics with means and standard deviations (SDs) for continuous variables and counts with percentages for categorical variables, by immigration and baseline diabetes statuses (Cohort 1) or by immigration and baseline depression statuses (Cohort 2).
Among immigrants and nonimmigrants, we compared baseline characteristics by baseline diabetes status (Cohort 1) or by baseline depression status (Cohort 2) using multivariable logistic regression models. We used these models to evaluate the associations between baseline diabetes and the risk of depression at 3 years in Cohort 1 and between depression at baseline and the risk of 3-year diabetes in Cohort 2. To assess the effect modification by immigration status, we included interaction terms for diabetes and immigration status and for depression and immigration status in the models for Cohort 1 and Cohort 2, respectively.
The baseline characteristics listed above were considered for inclusion in the multivariable model. Immigration status, sex and age were forced in all models. We removed other variables that were not significant (p > 0.5), did not affect the Bayesian Information Criterion upon inclusion and did not modify the effect of the main exposure variable by more than 10%.58,59 To make the estimates generalizable to the Canadian population, we used the CLSA analytical sample weights and geographic strata information in the regression analyses.60,61 Results were expressed in odds ratios (ORs) and 95% confidence intervals (CIs).
We also conducted sensitivity analyses. First, we defined baseline diabetes solely by the self-reported physician diagnosis and repeated the main analyses for Cohort 1. Second, we conducted the main analyses excluding individuals with missing variables. We repeated these analyses using multiple imputations to impute missing information using the Markov Chain Monte Carlo method, as implemented in SAS Proc MI.62 Five imputed data sets were generated based on all baseline characteristics. The results from these data sets were combined using Rubin’s rules,63 as implemented by SAS Proc MIANALYZE. We performed all statistical analyses using SAS version 9.4 (SAS Institute).
Ethics approval
Ethics approval was provided by the McGill University Health Centre Research Ethics Board.
Results
Diabetes at baseline and risk of depression at 3 years
Cohort 1 included 20 723 individuals (Figure 1), including 3766 (18.2%) immigrants. Among immigrants, 616 (16.4%) had diabetes at baseline, compared with 2639 (15.6%) among nonimmigrants (Table 1). In general, baseline characteristics that differed between individuals with or without baseline diabetes were similar in immigrants and nonimmigrants (Appendix 1, Table 1).
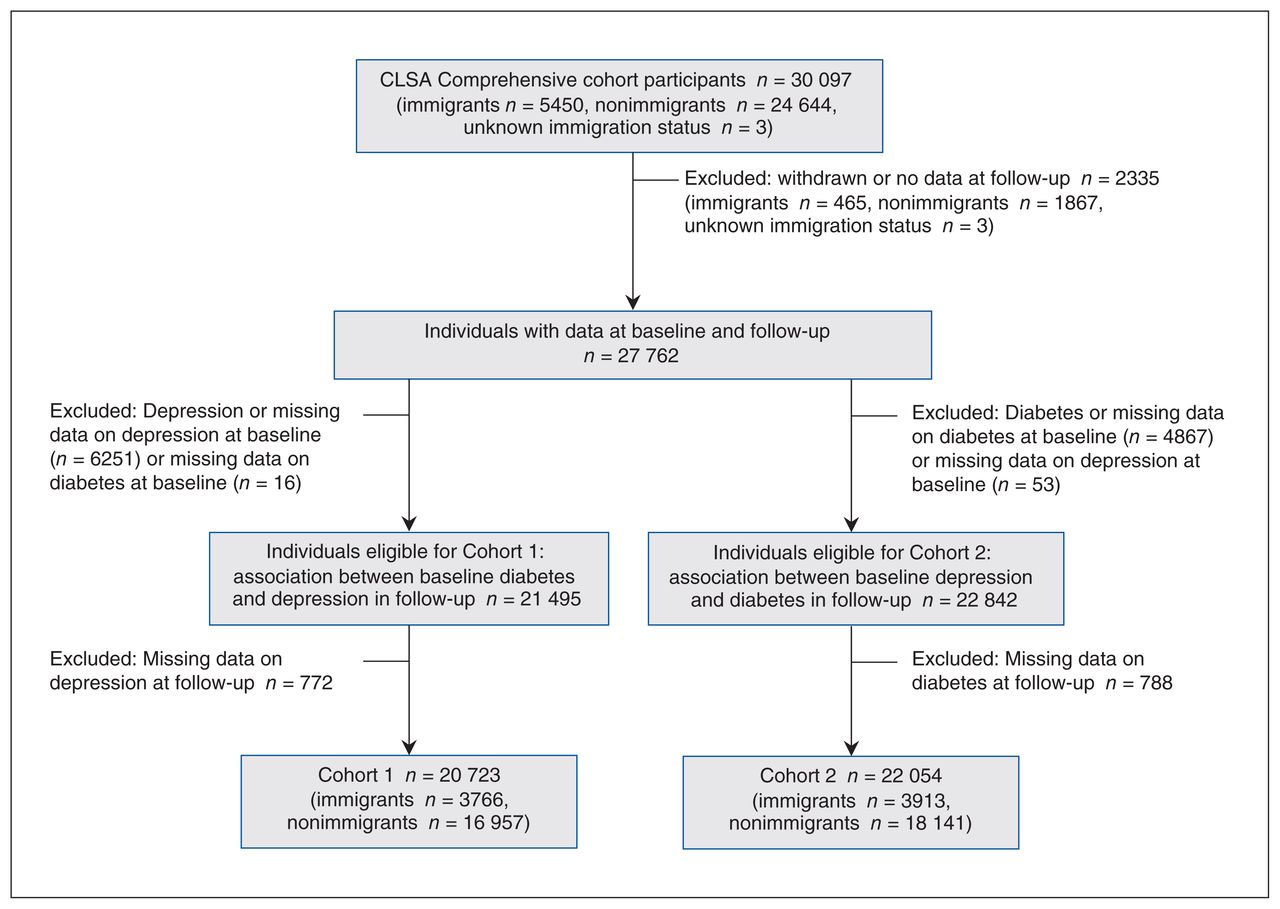
Flow chart of study cohorts. Note: CLSA = Canadian Longitudinal Study on Aging.
Baseline characteristics of Cohort 1 individuals with and without baseline diabetes by immigration status
Overall, 339 (10.4%) of people with diabetes had depression at 3 years, compared with 1465 (8.4%) people without diabetes. Among immigrants and nonimmigrants, respectively, 60 (9.7%) and 279 (10.6%) of those with baseline diabetes had depression at 3 years, compared with 265 (8.4%) and 1200 (8.4%), respectively, of those without baseline diabetes (Table 2).
Three-year incidence and risk of depression, stratified by immigration and diabetes status
In multivariable logistic regression models (Table 2), individuals with baseline diabetes had 18% higher odds of depression at 3 years than those without baseline diabetes (adjusted OR 1.18, 95% CI 1.01–1.37). Among nonimmigrants, baseline diabetes was associated with 27% increased odds of depression at 3 years (adjusted OR 1.27, 95% CI 1.08–1.49), whereas no significant association was observed among immigrants (adjusted OR 1.12, 95% CI 0.80–1.56).
Depression at 3 years was associated with being female, living with pain, current smoking (v. past or never), weight change in the previous year (loss or gain), living in Quebec (v. Ontario or British Columbia), being younger (45–60 v. 61–70 yr) and not being satisfied with sleep (Appendix 1, Table 3).
Baseline characteristics of Cohort 2 individuals with and without depression by immigration status
Depression at baseline and risk of diabetes at 3 years
Cohort 2 included 22 054 individuals (Figure 1), including 3913 (17.7%) immigrants (Table 3). Among immigrants, 762 (19.5%) had depression at baseline, compared with 3797 (20.9%) nonimmigrants. In general, baseline characteristics between individuals with or without baseline depression were similar in immigrants and in nonimmigrants (Appendix 1, Table 4).
Three-year incidence and risk of diabetes, stratified by immigration and depression status
Overall, 311 (6.8%) individuals with depression at baseline developed diabetes, compared with 837 (4.8%) of those without depression (Table 4). Among immigrants and nonimmigrants, respectively, 54 (7.1%) and 257 (6.8%) of those with depression at baseline developed diabetes, compared with 144 (4.6%) and 693 (4.8%) of those without depression at baseline.
In multivariable logistic regression models (Table 4), those with depression at baseline had 43% higher odds to develop diabetes than those without depression (adjusted OR 1.43, 95% CI 1.21–1.68). Among nonimmigrants, depression was associated with 39% increased odds of diabetes (adjusted OR 1.39, 95% CI 1.16–1.68); among immigrants, depression was associated with a 60% increased odds of diabetes (adjusted OR 1.60, 95% CI 1.08–2.37).
Overall, diabetes at 3 years was associated with being male, being younger (45–60 v. 71–85 yr), having hypertension, having heart disease, high waist circumference and weight change (v. same weight) (Appendix 1, Table 3).
Results of both sensitivity analyses were similar to those of the main analyses (Appendix 1, Table 2, Table 5, Table 6).
Interpretation
Our study provides evidence for a bidirectional association between diabetes and depression in the population aged 45 years and older. Overall, diabetes at baseline was associated with an increased risk of depression at 3-year follow-up, and depression at baseline was associated with an increased risk of diabetes at 3-year follow-up. In general, immigration status did not modify these risks in either direction. Specifically, although depression was associated with 39% and 60% increased odds of diabetes among nonimmigrants and immigrants, respectively, the overlapping 95% CIs did not suggest a conclusive modifying effect by immigration status. Moreover, although diabetes at baseline was associated with 27% increased odds of depression among nonimmigrants and a nonsignificant increase by 12% among immigrants, a modification effect by immigration status could not be concluded.
We had expected to observe differences in the bidirectional relation between diabetes and depression by immigration status because of the complex social determinants of health and stressors29 that immigrants live with and how these may potentially be associated with low-grade inflammation. 64–66 The lack of effect modification by immigration status in the diabetes–depression relation in our study may perhaps be explained by the resilience of immigrants in their dynamic process of positive adaptation.24,67
We did not find any published study that assessed depression incidence in immigrants and nonimmigrants with or without diabetes. Results from 2 meta-analyses evaluating the association between diabetes and depression incidence found a 24% increased risk of depression among people with diabetes, similar to our finding for immigrants and nonimmigrants combined.68,69 Higher risks of depression were also reported, with increased risks of macrovascular and microvascular complications of diabetes. 70 However, this could not be investigated in our study as diabetes complications were not specifically available in our data.
We found that nonimmigrants with diabetes were at 27% increased odds of depression at 3 years, whereas we did not observe a significant difference among immigrants. Most of the immigrants in our cohorts were white and had resided in Canada for more than 20 years, which may explain the lack of association.71
In our study, the 43% increased risk of developing diabetes in individuals with depression is close to the 34% increase in pooled risk reported by a meta-analysis.69 The meta-analysis included cohort, cross-sectional and case–control studies that considered both prevalent and incident diabetes, in contrast to our study, which considered only incident diabetes. The increased risk of diabetes among people with depression has been attributed to lack of compliance with dietary and weight loss recommendations.72 Furthermore, antidepressant use may affect cortisol pathways that stimulate weight gain, and in turn lead to diabetes.32,33 Risk factors for diabetes in our study were similar to those reported in other studies.73,74
Among individuals older than 45 years, regardless of immigration status, we suggest that clinicians screen for depression in those with diabetes and for diabetes in those with depression as early detection may prevent complications. This suggestion is supported by the Canadian Collaboration for Immigrant and Refugee Health clinical guideline.1,75
Limitations
Strengths of our study include the use of high-quality data from the carefully designed, longitudinal, population-based CLSA database. Our study also used a longitudinal design and direct measurement of depressive symptoms (CES-D-10) or treatment for depression, and diabetes (self-reported diagnosis and HbA1c at baseline). Nonetheless, it has some limitations. Although we used survey weights in our analyses, participation bias cannot be ruled out.76 In addition, the CES-D-10 tool and the definition of diabetes use self-reported information that come with measuring errors and information bias.77 These errors may have differed between immigrants and nonimmigrants because of possible language barriers and culture-related social desirability.78 Furthermore, diabetes at follow-up was identified by self-report only because CLSA laboratory data were not available at that time point. However, this likely did not affect our results because the proportion of people identified as having diabetes solely by laboratory data is expected to be very small (about 2% at baseline). Information on complications of diabetes was not available in the database; poor glycemic control79 and increased risk of complications70 may increase the risk of depression.
We did not differentiate by diabetes type because about half of participants declared not knowing their diabetes type (reported neither type 1 nor type 2) and only 2.6% at baseline and 0.6% in follow-up of people with diabetes at these time points declared having type 1 diabetes. Around 87% and 63% of immigrants in our cohort were in Canada for more than 20 years and over 40 years, respectively. Therefore, generalizability of our results to recently arrived immigrants should be done with caution. Despite the large overall sample size, confidence intervals for interaction effects were wide, and thus modest effect modification cannot be ruled out.
Finally, a small number (1.5%) of the CLSA participants were not white, and hence, we were unable to evaluate ethnic subgroups.2–4,69 The proportion of immigrants and nonimmigrants in our study who were not white (n = 1140, 4.1%) was lower than the proportion of visible minorities in Canada (19.1%) reported in 2011.80 Population cohorts are based on voluntary participation and participants may be different from nonparticipants.81 However, our study lacks information on nonparticipants, and generalizability of our results to visible minority groups should be done with caution.82
Conclusion
We found an overall bidirectional association between diabetes and depression that was not significantly modified by immigration status. Although the association between diabetes and depression was statistically significant in both directions among nonimmigrants, only one direction (depression predicting diabetes) was statistically significant among immigrants. Future studies should investigate the bidirectional association of diabetes and depression among recently arrived immigrants and those of visible minority groups.
Acknowledgements
The authors thank the Canadian Longitudinal Study on Aging (CLSA) National Coordinating Centre for providing the data for this analysis. Funding for the CLSA is provided by the Government of Canada through the Canadian Institutes of Health Research under grant reference LSA 94473.CLSA 9447 and the Canada Foundation for Innovation. The CLSA is led by Drs. Parminder Raina, Christina Wolfson and Susan Kirkland. The opinions expressed in this manuscript are the authors’ own and do not reflect the views of the CLSA.
Footnotes
Competing interests: None declared.
This article has been peer reviewed.
Contributors: Doaa Farid and Elham Rahme contributed to the conception and design of the work. Doaa Farid and Elham Rahme contributed to the acquisition and analysis of the data. All of the authors contributed to the interpretation of the data. Doaa Farid drafted the manuscript. All of the authors revised it critically for important intellectual content, gave final approval of the version to be published and agreed to be accountable for all aspects of the work.
Data sharing: The data in this study are from the Canadian Longitudinal Study on Aging, under Application Number 1909010. Data are available from the Canadian Longitudinal Study on Aging (www.clsa-elcv.ca) for researchers who meet the criteria for access to deidentified CLSA data.
Supplemental information: For reviewer comments and the original submission of this manuscript, please see www.cmajopen.ca/content/10/2/E508/suppl/DC1.
This is an Open Access article distributed in accordance with the terms of the Creative Commons Attribution (CC BY-NC-ND 4.0) licence, which permits use, distribution and reproduction in any medium, provided that the original publication is properly cited, the use is noncommercial (i.e., research or educational use), and no modifications or adaptations are made. See: https://creativecommons.org/licenses/by-nc-nd/4.0/
References
- © 2022 CMA Impact Inc. or its licensors
In this issue

Article tools


Related Articles
Cited By...
- No citing articles found.