


Abstract
Background: Risk is a ubiquitous part of health care. Understanding how people respond to risks is important for predicting how populations make health decisions. Our objective was to seek preliminary descriptive insights into the attitude to health risk in the Canadian population and factors associated with heterogeneity in risk attitude.
Methods: We used a large market-research panel to survey (in English and French) a representative sample of the Canadian general population that reflected the age, sex and geography of the population. The survey included the Health-Risk Attitude Scale, which predicts how a person resolves risky health decisions related to treatment, prevention of disease and health-related behaviour. In addition, we assessed participants' numeracy and risk understanding, as well as income band and level of education. We summarized the responses, and we explored the independent associations between demographics, numeracy, risk understanding and risk attitude in multivariable models.
Results: Of 6780 respondents, 4949 (73.0%) were averse to health risks; however, but there was considerable heterogeneity in the magnitude of risk aversion. We found significant gradients of risk averse attitudes with increasing age and being female (p < 0.001) using the multivariable model. French-speaking participants appeared to be more risk averse than those who were English-speaking (p < 0.001), as were individuals scoring higher on the Subjective Numeracy Scale (p < 0.001).
Interpreation: In general, Canadians were averse to health risks, but we found that a sizeable, identifiable group of risk takers exists. Heterogeneity in preferences for risk can explain variations in health care utilization in the context of patient-centred care. Understanding risk preference heterogeneity can help guide policy and assist in patient-physician decisions.
Uncertainty is inherent to most health information and evidence. Because decision-making in the presence of uncertain evidence involves the risk of unfavourable outcomes, personal attitude to risk guides many of the health decisions that people make.1 Some individuals can exhibit risk-seeking health behaviour, such as avoiding an effective but burdensome treatment that can prevent disease progression,2 whereas others are deterred by even small risks (e.g., avoiding immunization because of the small risk of adverse effects, thus failing to benefit from immunization).3 Understanding these attitudes can help explain variations in health care utilization,4 which in turn may enable policies such as public health interventions to be tailored to specific persons. Previous surveys of the general population found that most people tend to be averse to general risks, but there is a small group of people who are risk seeking and some who are risk neutral.5,6 These studies found associations between attitudes to risk and certain population characteristics. For example, on average, women tend to be more averse to general risks than men,7 and white people tend to be more risk averse than nonwhite people.8
Previous evidence suggested risk attitudes can vary across outcomes and domains, such that someone might be risk averse to financial decisions but risk seeking when it comes to decisions related to health.9,10 Therefore, we hypothesized that we could not infer from the results of surveys of Canadians' propensity for general11 and financial risks12 as being representative of their propensity for health risks. Our objective was to use the Health-Risk Attitude Scale13 to provide preliminary descriptive insights about the attitude to health risk in the Canadian population, understand the distribution of attitudes and any associations with population characteristics and describe how the results can be used by policy-makers, health care providers and patients to improve their decision-making.
Methods
Survey and participants
We used data from 2 research projects that sought to understand general population preferences for different health outcomes, which included questions on risk attitudes to explain variation in preferences.14,15 We prepared web surveys with a range of questions that were available in English or French (Appendix 1, available at www.cmajopen.ca/content/4/2/E284/suppl/DC1). The surveys were tested before launch in 3 focus groups (2 English, 1 French).
Our target population was adults who were representative of the Canadian population. Canadian residents 18 years of age and older were recruited by email through a market research agency from a panel of residents who previously consented to participate in research. Quota sampling was used to ensure the sample represented the general Canadian population in terms of age, sex and geographical distribution. Once respondents had indicated their preferred language, they were presented with the study information and asked to provide consent. The survey collected information on risk attitude, demographic and socioeconomic characteristics, and measures of numeracy and health literacy. Ethical approval for the study was granted by the University of British Columbia Behavioural Research Ethics Board.
Measurement of attitude to health risk
A person's attitude to risk is typically elicited in experimental studies, where lotteries measure risk-taking behaviour by staking real money.6 A person is risk averse if they prefer a certain outcome over a risky outcome with a higher expected reward. For example, they may prefer $40 rather than take a gamble with a 50% chance of receiving $100 and 50% of receiving nothing (where the expected outcome of the latter option is $50, i.e., (0.5 × $0) + (0.5 × $100)). Unfortunately, such lottery tasks can be cognitively challenging for many to understand,16 particularly in web surveys where an interviewer is not on hand to explain the questions.17 However, excluding participants who are unable to complete the task from such surveys can jeopardize the generalizability of the interpretations. In response, scales have been developed that serve as proxies for risk attitude. These scales are simple to administer using web surveys and ask a series of qualitative questions that are easier for people to understand in comparison with lottery-style questions.
Although there are numerous scales that measure general risk attitude, few scales measure health risk attitude specifically. The Domain-Specific Risk-Taking (DOSPERT) scale11 is the most used instrument for risk attitude measurement. It has a health and safety subscale that focuses on risky behaviour, such as smoking and unprotected sex, rather than aspects of medical treatments. A medical subscale of the DOSPERT has been developed,18 but it requires administration alongside the main scale; therefore, participants must answer 35 questions in total. We used the Health-Risk Attitude Scale, which has been shown to be internally consistent (Cronbach α = 0.83) and reliable (test-retest intraclass correlation coefficient = 0.86), with good construct and convergent validity.13 Importantly, the Health-Risk Attitude Scale has only 13 questions and takes less time to complete compared with the DOSPERT scale while providing high completion and response rates.13 This scale was developed to predict how a person would resolve risky health decisions in the future and features items related to medical treatment, preventative health behaviour and risky health behaviour. Each of the 13 questions (7 are reverse coded) are scored from 1 (agree) to 7 (disagree), which results in a total score that ranges from 13 to 91, where a higher score indicates a more risk-averse attitude. We rescaled this score to between 0 and 100, with a score of 50 indicating risk neutrality.
Additional variables
Participants were members of a market research panel who had agreed to participate in various surveys. We collected information on age, sex, Canadian province or territory, level of education and household income of the panel members who participated in the survey. These variables have been previously found to be associated with aspects of risk-taking behaviour.5,7,11 We also explored whether aspects of numeracy and health literacy were associated with health risk attitude. These outcomes have been associated with variations in health outcomes and health care utilization,19 and related concepts associated with general risk-taking behaviour.16
We used the Subjective Numeracy Scale20 to measure respondents' self-assessed ability in mathematical tasks and their preference for information presented numerically or in text.20 This scale has been validated and found to correlate highly with objective measures of numeracy and is quicker and less burdensome for participants to complete than surveys containing objective numeracy questions.21 We used additional questions to determine whether individuals could process and understand risk information, such as probabilities. These questions had 2 parts and were adapted from a previous study;22 respondents were presented with a test of gist and verbatim-type risk knowledge.
In the gist question, a visual representation (100 people) is used to describe the risk of withdrawal for 2 treatments: treatment A (5 out of 100 people will have to stop taking the treatment) and treatment B (10 out of 100 people will have to stop taking the treatment). The respondent was asked to choose if they preferred treatment A, treatment B or were unsure. The verbatim question then asked how much more likely the risk of treatment A/B (irrespective if they answered this correctly) was compared with the risk in treatment B/A by selecting a number between 1 and 10 from a drop down box. A correct answer was considered to be treatment A, followed by 2 times more likely than treatment B.
Statistical analyses
All analyses were based on respondents who had completed the survey. Sociodemographic information is described using the mean and standard deviation for continuous variables and numbers and percentages for categorical data. Where possible, we compared demographic data from participants who had completed the survey with those who did not complete the survey to detect response bias. For participants who completed the survey, we then analyzed univariable associations both descriptively and using Cohen's d effect size.23 Independent associations between risk attitude and respondent demographic characteristics, numeracy and risk understanding were explored using a multivariable ordinary least squares model, with the scaled score (i.e., 0-100) as the dependent variable. All analyses were performed in Stata v8.0.
Results
Participant characteristics
Of 9363 adults who responded to the invitation to participate in the survey, 6780 (72.4%) completed all questions. The majority of participants who did not complete the survey did not progress past the introduction screen, which suggests dropout was not related to the complexity of the questions. The sociodemographic characteristics of respondents compared with the Canadian general population are shown in Table 1.25,26 Mean age of the respondents was 44 (SD 15) years. In the sample population, 3668 participants (54.1%) were women, 19.3% were Francophones, and all provinces and territories were represented. Overall, the sample was representative of the general adult population in Canada, except for education (adults with less than secondary education were underrepresented) and older age (adults > 70 yr of age were underrepresented).
In the sample population, 2714 (40.0%) participants reported a preference for and a good ability to use numerical information based on the Subjective Numeracy Scale. Overall, 4788 respondents (70.6%) correctly answered the simpler gist risk knowledge question and preferred the option with the smaller risk, whereas 915 (13.5%) were unsure and 1077 (15.9%) answered incorrectly. Of the 4788 respondents who correctly answered the initial question, 3482 (72.7%) correctly answered the more complex verbatim knowledge question (identifying that the larger risk was 2 times higher), 1174 (24.5%) incorrectly described the risk to be between 3 and 10 times higher, and 132 (2.8%) were unsure.
Risk attitude and its associations
Descriptive results for the Health-Risk Attitude Scale are provided in Table 2 and Figure 1. Most respondents were averse to health risks (n = 4949, 73.0%); 13.0% (n = 881) were risk seeking and the remaining 14.0% (n = 949) were risk neutral. The mean score was 58.7 (SD 9.6).
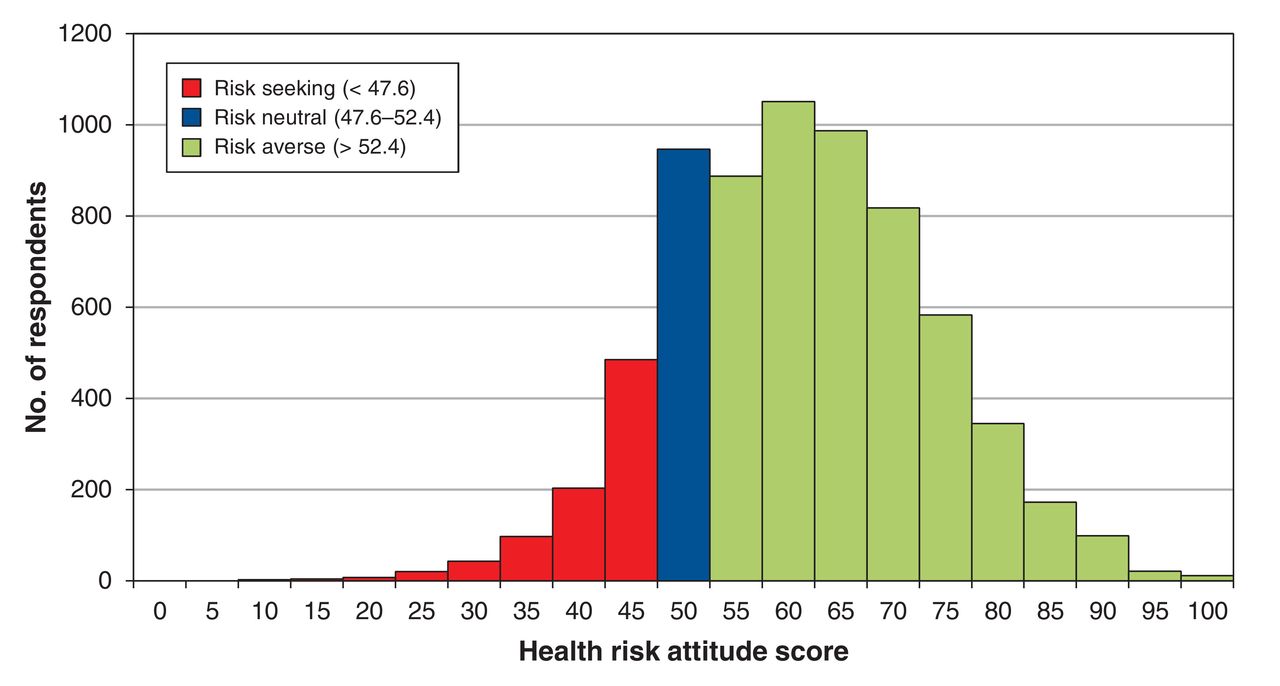
Distribution of health risk attitudes.
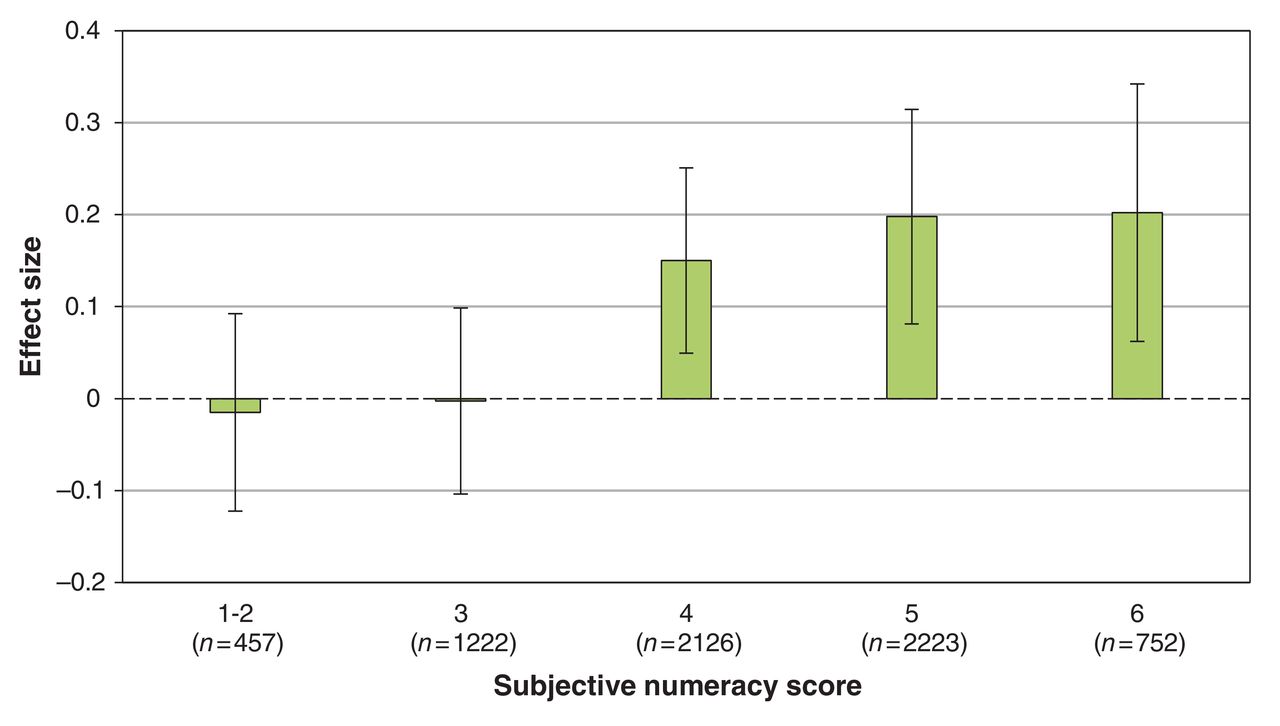
The association between age, sex and risk attitude is described in Figure 2. Across age groups, men were more risk seeking than women (p < 0.001). For both sexes, the proportion of respondents who were risk seeking decreased with increasing age (p = 0.013 for men and p < 0.001 for women). More numerate participants were more averse to health risk (p < 0.001) (Figure 3).
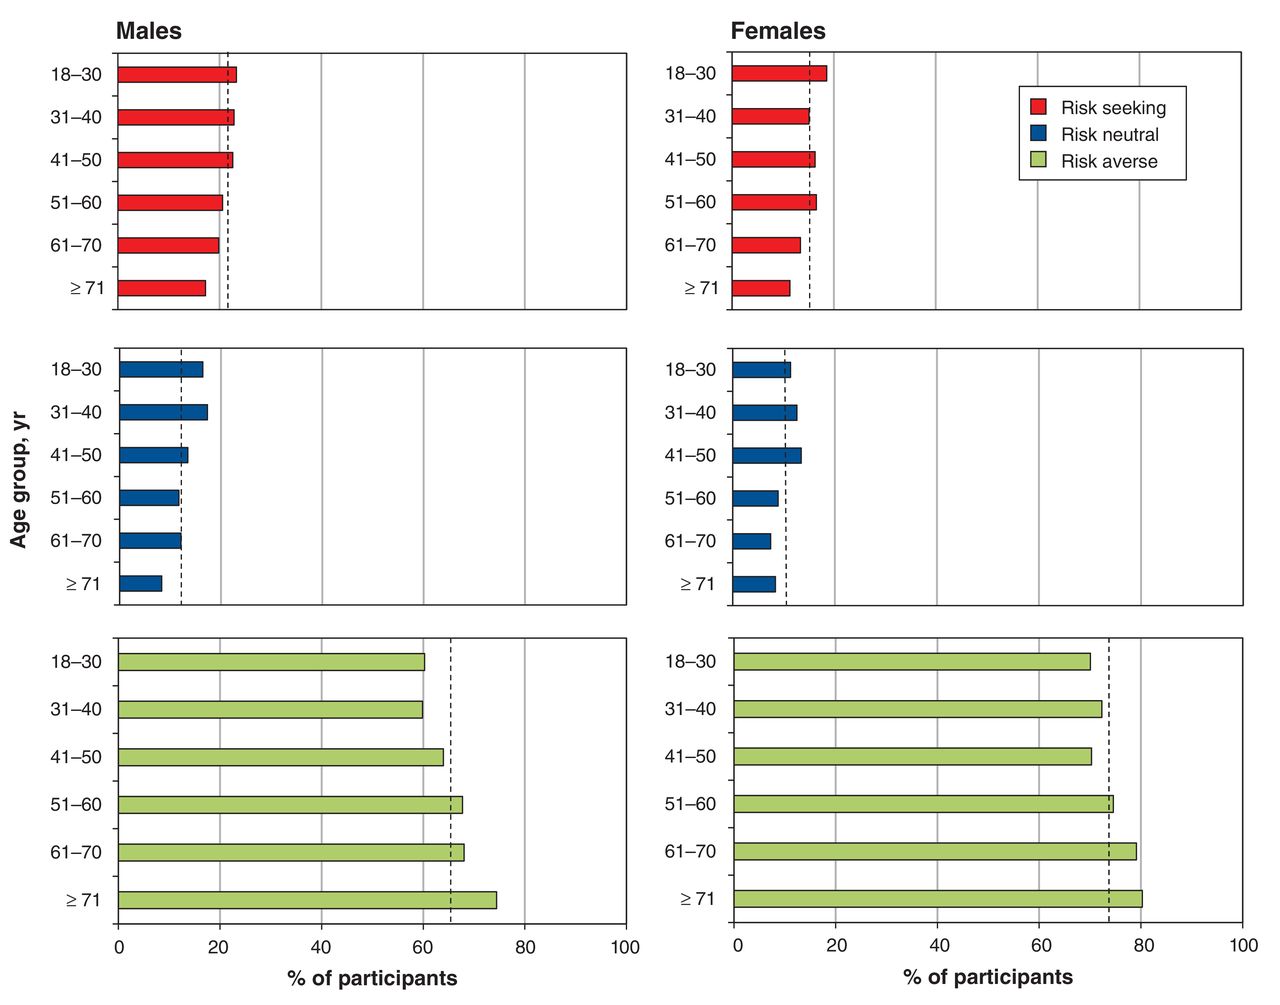
Association between health risk attitude and age and sex. The overall percentages of participants who were risk seeking, risk neutral and risk averse are shown, by sex and within each sex, by age group. Dashed lines on each graph indicate average percentage within each sex that falls into each profile.

Association between preference and ability for numerical information and risk attitude among participants. Note: Effect size measured using Cohen's d (d = 0.2 is considered a small effect size, d = 0.5 is considered a medium effect size and d = 0.8 is considered a large effect size).
Results from the multivariable model found significant gradients of an increasingly risk-averse attitude with increasing age, being female, and having higher reported preference and ability for numerical information (Table 3). French-speaking participants appeared to be more risk averse than those who were English speaking (p = 0.02). Those with incomes of $150 000 and more and those preferring not to answer income questions were significantly more risk averse than those with incomes less than $15 000. No association was found with level of education or the health literacy questions that determine risk comprehension.
Interpretation
Main findings
We surveyed health risk attitude in a representative population of over 6000 Canadians. We found substantial heterogeneity in risk attitude among survey respondents. Although most respondents tended to be averse to health risk, nearly 1 in 8 were willing to take health risks. We found certain characteristics to be associated with varying risk attitudes: willingness to take risks was negatively related to age and high-level numeracy skills, and positively related to being male.
Comparison with existing studies
Our findings align with a survey of over 22 000 participants living in Germany, which used a simpler, 1-item measure of risk attitude but compared responses for general risk to responses with other domains, such as driving a car, financial matters, leisure and sports, career and health.5 Similar to our findings, the German study found that women were significantly less willing to take health risks than men, and increasing age decreased the probability that a person was willing to take health risks. Another similar finding related to participant level of education, which was not strongly associated with health risk attitude. This differs from the significant negative association reported in the literature regarding increasing level of education and aversion to financial risk.5
Previous studies found individuals with lower levels of numeracy tend to be more risk averse.16 Our findings show this also to be true in the health domain. Research has found increasing levels of numeracy are required to facilitate access to care, engagement with medical treatment and informed decision-making.27 However, most numeracy studies in the health literature focus on associations with risk perception, where the need for numerical understanding is more clear.28 In terms of its association with risk attitude, research suggests that numeracy is influenced by cognitive skills that may influence the processing of information, thus affecting subsequent decision-making.29
Limitations
There are limitations that are important to consider. Further validation of the Health-Risk Attitude Scale will be important, in particular to determine its ability to predict actual risk behaviour. Such a validation exercise is more complex in a health context compared with finance, where investment decisions can be more readily compared. However, correlation between risk attitude and behaviours such as screening uptake and sunscreen use should be expected. As a measure, the Health-Risk Attitude Scale does not include measures of risk perception that previous studies have found to be an important influence of risk-taking behaviour.30 It would also be useful to compare the Health-Risk Attitude Scale with results from a general risk attitude scale to clarify whether differences are domain specific.
From a sampling perspective, the study included Internet users from a market-research panel. Although these Internet users are representative of the age, sex and geographical location of the Canadian population, they may not be truly representative (e.g., participants in our survey are most likely to be more computer literate than the general population).31 Our measure of health literacy was limited, because it focussed on participants' risk comprehension but did not measure participants' capacity to obtain, process and understand general health information. This limited our ability to explain the association between health literacy and risk behaviour but did not affect our main findings regarding the extent of heterogeneity in health risk attitude.
Conclusion
From a policy-making perspective, our findings might explain some of the observed differences in health care utilization among Canadians. For example, an intervention with a risk of an adverse effect may be less appealing to older women than to younger men. Beyond the equity issues this raises for the funding of treatments and technologies, this understanding can allow policies to be tailored to certain groups. From a health professional perspective, in an era of demand for patient-centred care, it is important to provide care that aligns with patient values and preferences.32 Just as a financial advisor would ask their client to answer questions about their attitudes toward financial risks, a short health risk attitude questionnaire could be embedded in patient decision aids, thus enabling doctors to make more value-congruent decisions with their patients about treatment options that involve risks. From a patient perspective, facilitating understanding of their own attitude to risk in comparison with others can help explain different health behaviours and treatment preferences. This might bring reassurance or help people explain to others the reason for their decisions.
This study found health risk attitudes can vary considerably. We identified that most participants tended to be averse to health risks and tended to have common characteristics. These results can be used by policy-makers, health professionals and patients to understand individual health decisions, help design better interventions that can target specific populations with different risk tolerances and improve shared decision-making for health decisions involving risks.
Acknowledgements
Funding for the study was provided by the Canadian Centre for Applied Research in Cancer Control, which is funded by the Canadian Cancer Society Research Institute. Nick Bansback is a Canadian Institutes of Health Research New Investigator. Supplemental information: For reviewer comments and the original submission of this manuscript, please see www.cmajopen.ca/content/4/2/E284/suppl/DC1
Footnotes
Competing interests: Nick Bansback has received a grant from the Canadian Centre for Applied Research in Cancer Control (funded by the Canadian Cancer Society Research Institute). No other competing interests were declared.
Contributors: Nick Bansback and Mark Harrison contributed substantially to the conception and design of the study. All of the authors contributed substantially to the analysis and interpretation of the data. Nick Bansback drafted the article, and Mark Harrison, Mohsen Sadatsafavi, Anne Stiggelbout and David Whitehurst revised it critically for important intellectual content. All of the authors gave approval of the final version to be published and agreed to act as guarantors of the work.
References
- Copyright 2016, Joule Inc. or its licensors
In this issue

Article tools


Related Articles
Cited By...
- No citing articles found.