


Abstract
Background: Little is known about trends in the treatment of problematic cannabis use in Canada. Trends in treatment utilization for problematic cannabis use were examined, as well as trends in the associated sociodemographic characteristics and frequency of cannabis use.
Methods: This was a repeated cross-sectional study using data from the Drug and Alcohol Treatment Information System, capturing utilization of all community funded addiction treatment services in Ontario, Canada. Clients in treatment for their own problematic cannabis use from 2010/11 to 2015/16 were included. Two distinct groups were formed: clients with problematic cannabis use only (the cannabis-only group) and clients with problematic use of cannabis and other substances (the cannabis-plus group). Estimates of the number of clients in each of these groups and their cannabis use frequency (past 30 days) were characterized over time by new admissions and total caseload (new admissions plus carryovers).
Results: There were 152 984 admissions for 83 621 clients over the study period. The number of clients with new admissions in the cannabis-only group decreased from 2954 (95% confidence interval [CI] 2848–3062) in 2010/11 to 2342 (95% CI 2248–2439) in 2015/16. Similar downward trends were observed in the number of clients in the total caseload of this group. The number of clients with new admissions in the cannabis-plus group was stable, but the total caseload increased from 20 139 clients (95% CI 19 862–20 419) in 2011/12 to 21 816 (95% CI 21 527–22 107) in 2015/16. Proportions of daily cannabis use increased among clients in both groups.
Interpretation: The number of clients in treatment for problematic cannabis use only decreased over the study period, but the frequency of cannabis use increased among clients in both groups. Given the potential reductions in treatment that is unnecessary from a clinical standpoint, alignment of treatment programming with disorder severity may be warranted.
Cannabis is the most commonly used illicit substance in Canada, with its 12-month prevalence doubling to 12% between 1985 and 2015.1 Cannabis use has similarly increased by 67% in Ontario during the last 20 years, rising from 8.7% in 1996 to 14.5% in 2015.2 Public opinion about cannabis control policies has shifted away from favouring prohibition,3 leading the federal government to table and pass the Cannabis Act. This legislation outlines the framework for controlling the production, distribution, sale and possession of cannabis in Canada.4 Cannabis use has become less stigmatized and more accepted as normative behaviour.5,6
Given these developments, it is of interest to examine trends in cannabis-attributable harms. About 9% of cannabis users develop cannabis use disorder,7 a state characterized by problematic use despite clinically significant impairment or distress.8 The number of clients in treatment for problematic cannabis use may be decreasing. Cannabis users, especially less frequent users, may be less likely to perceive consumption as harmful or be mandated into treatment because of the increased acceptance of cannabis use as normative behaviour. Most pertinent studies from Canada are outdated and based on clinical samples from single agencies.9–13 Some system-level evidence from Ontario, however, lends support to this idea.14–16 The frequency of cannabis use may be increasing at the same time, as the distribution of the remaining clients would be skewed toward the severe end. Although studies from Canada characterizing the frequency of cannabis use among clients in treatment for problematic cannabis use are not available, the prevalence of daily cannabis use has risen among clients entering treatment for the first time for problematic cannabis use in the European Union.17 Using health administrative data from Ontario, we examined trends in treatment utilization for problematic cannabis use between fiscal years 2010/11 and 2015/16, as well as trends in the associated sociodemographic characteristics and frequency of cannabis use.
Methods
Study setting, design and data source
A repeated cross-sectional design was operationalized on the basis of admissions to Ontario’s specialized treatment system for alcohol and drugs. Data were obtained from the Drug and Alcohol Treatment Information System, the reporting system for provincially funded addiction treatment services in Ontario, encompassing all clients who receive nonmedical, community-funded services (i.e., services that are funded through the community stream of funding rather than the physician or hospital stream of funding by the Ministry of Health and Long-Term Care).18 More than 150 agencies submit data on clients’ service utilization and characteristics for each fiscal year (Apr. 1 to Mar. 31) because of a mandatory funding requirement by Ontario’s Ministry of Health and Long-Term Care since 2008/09 (for participating agencies see Table S1, Appendix 1, available at www.cmajopen.ca/content/6/4/E495/suppl/DC1]).18 These agencies deliver a range of referral, outpatient, residential and withdrawal management services. Private, self-help and pharmacotherapeutic services are not included. For descriptions of similar systems across Canada, see the National Treatment Indicators reports.15,16
The Drug and Alcohol Treatment Information System incorporates validity safeguards that are based on business and logic rules in the data entry platform. In addition, the majority of the data are entered using picklists, thereby minimizing the potential for errors. The data entry platform also functions as a case management tool for some agencies, which serves as an incentive for these organizations to maintain the accuracy and completeness of the data. Importantly, an annual data quality review is conducted for all agencies, where data elements are evaluated and rated (see the data quality review section of Appendix 1 for methodology). On the basis of the expert opinion of the Data Quality Team, the pass threshold is set at 65% to ensure reliability in accountability reporting and system planning. About 60% of the agencies obtained passing scores in the data quality reviews conducted between 2013/14 and 2015/16. The reasons why agencies did not pass included absence of consequences, competing reporting requirements, not entering data in real time, not using data in management and planning, resource limitations and staff attrition.
Measures
Admissions hereunder refer to admissions recorded in the database, irrespective of the agency. Clients indicate up to 5 nonranked problem substances at admission that are to be addressed by the treatment plan. These are the substances that led the clients to seek treatment. We divided clients on the basis of this information into 2 groups for each fiscal year: (a) cannabis only, for clients with problematic cannabis use only, and (b) cannabis plus, for clients with problematic use of cannabis and other substances. These classifications did not necessarily correspond to clinical diagnoses, nor were they confirmed by blood or urine measurements; rather, they described cannabis use that was perceived by clients or others to need treatment. We want to emphasize that in this study we captured cannabis use in need of treatment rather than cannabis use per se, as there is a separate database field for substances used in the past 12 months. Therefore, cannabis was clearly relevant to the admission in the cannabis-only group, whereas it was one of the substances addressed by the treatment plan in the cannabis-plus group.
The sociodemographic characteristics examined in this study included age (< 18 yr, 18–24 yr, 25–44 yr, > 44 yr), sex (men, women), relationship status (married, single, widowed, separated or divorced), educational attainment (did not complete secondary school, completed secondary school, some postsecondary, completed postsecondary), employment status (full- or part-time, unemployed, student/retraining, disabled, not in labour force), legal problems (none, awaiting trial or sentencing, probation, parole or incarcerated, other) and mandated treatment (the organization or individual requiring the client to seek treatment: none, legal system, child welfare authority, employee or school authority, family, other). The categories for cannabis use frequency in the past 30 days were as follows: did not use; 1–3 times monthly; 1–2 times weekly; 3–6 times weekly; daily; and binge (defined as periodic and excessive consumption).
Selection criteria for admissions
Admissions that began between 2010/11 and 2015/16 were included. The exclusion criteria consisted of admissions involving (a) clients’ family members receiving treatment on their behalf, (b) clients without Ministry of Health and Long-Term Care funding, (c) services only for gambling problems, (d) missing problem substance data, and (e) services only for problematic use of substances other than cannabis. It was not possible to determine if admissions were from the same or a different encounter because of the absence of a set definition.
Statistical analyses
For each fiscal year, 2 sets of client estimates were generated for the cannabis-only and cannabis-plus groups: new admissions and total caseload (new admissions plus older admissions continuing from previous fiscal years) (see the classification methodology section in Appendix 1 for further details). The methodology yielded unduplicated client estimates, as there was no overlap between the groups in a fiscal year. As an example, there were 2342 clients in the cannabis-only group who had new admissions in 2015/16. They were included alongside 1308 clients with older admissions continuing from previous fiscal years in the total caseload, resulting in a total of 3650 clients. None of these clients were included in the cannabis-plus group in 2015/16. The total caseload estimates for 2010/11 did not include older admissions continuing from previous fiscal years because of the underlying study design. Therefore, these estimates were not generated and were excluded from all trend analyses. Exact Poisson confidence intervals were generated, with regression analyses used for the assessment of linear trends. χ2 analyses were subsequently used to assess trends in sociodemographic characteristics and cannabis use frequency, with the former trend analyses limited to clients with new admissions. Because the number of missing data were low (< 3% for all measures), imputation procedures were not used.
Ethics approval
This study was approved by the Centre for Addiction and Mental Health Research Ethics Board.
Results
The data analyzed included 152 984 admissions from 83 621 clients (see Figure S1, Appendix 1, for flow diagram). There were 25 463 admissions that started in 2010/11, 26 413 admissions in 2011/12, 25 399 admissions in 2012/13, 25 623 admissions in 2013/14, 25 258 admissions in 2014/15 and 24 828 admissions in 2015/16 (linear trend p = 0.2). The average admission length (for completed admissions) was 100.10 days. There were an average of 1.83 admissions per client, with more than 90% of clients having 3 or fewer admissions.
Trends in treatment utilization
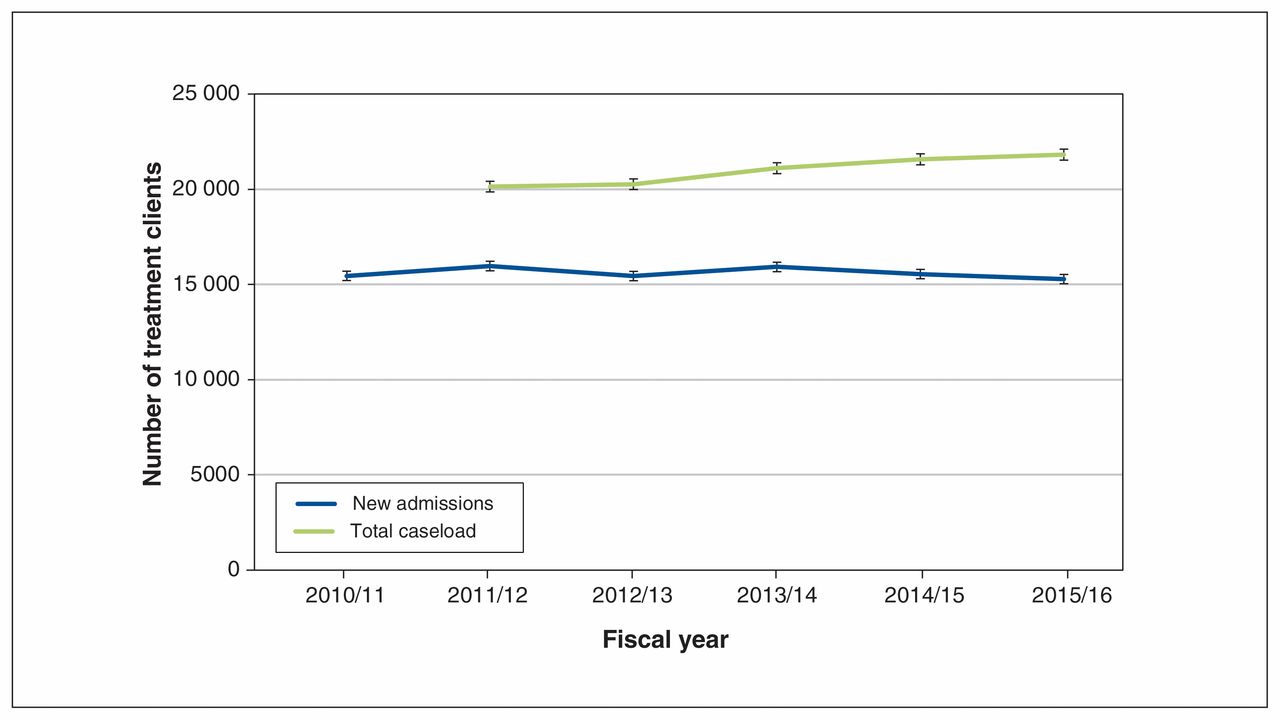
Trends in the estimates of the numbers of clients in the cannabis-only and cannabis-plus groups are depicted in Figures 1 and 2, respectively (see Table S2 in Appendix 1 for the data).
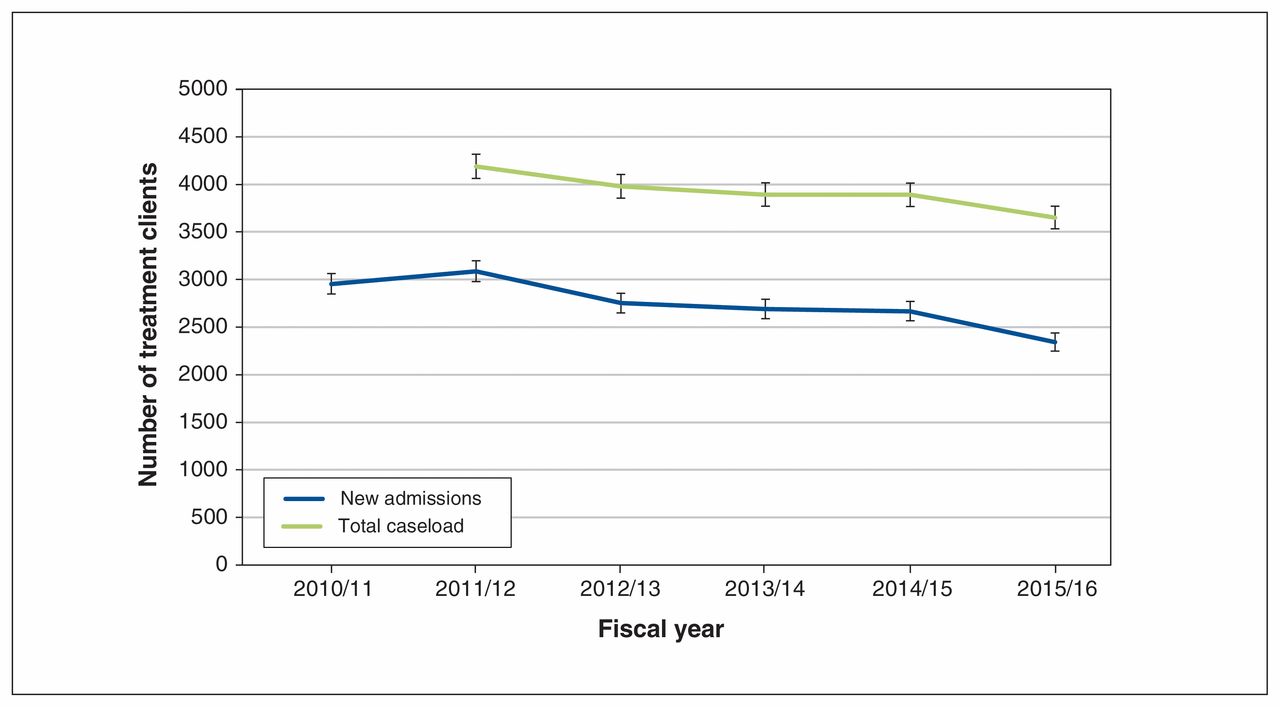
Estimates of the numbers of clients in the cannabis-only group between 2010/11 and 2015/16.

Estimates of the numbers of clients in the cannabis-plus group between 2010/11 and 2015/16.
After increasing between 2010/11 and 2011/12, the number of clients with new admissions decreased annually in the cannabis-only group. The number of clients with new admissions decreased overall from 2954 clients (95% confidence interval [CI] 2848–3062) in 2010/11 to 2342 clients (95% CI 2248–2439) in 2015/16. Similar decreases were observed in the number of clients in the total caseload: 4188 clients (95% CI 4062–4317) in 2011/12 to 3650 clients (95% CI 3533–3770) in 2015/16 (linear trend p = 0.01).
The number of clients with new admissions in the cannabisplus group was stable between 2010/11 and 2015/16. However, there were annual increases in the number of clients in the total caseload, from 20 139 clients (95% CI 19 862–20 419) in 2011/12 to 21 816 clients (95% CI 21 527–22 107) in 2015/16 (linear trend p = 0.005).
Trends in sociodemographic characteristics
Trends in the sociodemographic characteristics of clients in the cannabis-only and cannabis-plus groups are presented in Table 1. The proportions of clients who were men (Δ [percentage change] 2%–4%), had not completed secondary school (Δ 17%–19%) and were students or retraining (Δ 28%–32%) decreased in both groups over the study period, whereas the proportions of clients with no mandated treatment (Δ 12%–14%) increased. Age increased overall in both groups; the proportion of clients younger than 18 years of age (Δ 27%) decreased in the cannabis-only group and the proportion of clients 25–44 years old (Δ 10%) increased in the cannabis-plus group. In terms of relationship status, the proportions of clients who were single (Δ 4%) and separated or divorced (Δ 8%) decreased in the cannabis-only and cannabisplus groups, respectively. Although the proportion of clients who were awaiting trial or sentencing (Δ 34%) increased in the cannabis-only group, there were decreases in the proportion of clients who were probational, paroled or incarcerated (Δ 20%) in the cannabis-plus group.
Trends in sociodemographic characteristics of clients in the cannabis-only and cannabis-plus groups between 2010/11 and 2015/16
Trends in frequency of cannabis use
Trends in the frequency of cannabis use in the cannabis-only and cannabis-plus groups are presented in Table 2. For clients with new admissions in the cannabis-only group, there were annual fluctuations in the frequeny of cannabis use. However, the proportion of clients with daily cannabis use increased overall by 31%, rising from 37% in 2010/11 to 48% in 2015/16. Similar trends for daily cannabis use were observed in clients in the total caseload in the cannabis-only group (Δ 17%), as well as in clients with new admissions and in the total caseload in the cannabis-plus group (Δ 12% and 7%, respectively).
Trends in frequency of cannabis use among clients in the cannabis-only and cannabis-plus groups between 2010/11 and 2015/16
Interpretation
The number of clients in treatment only for problematic cannabis use decreased between 2010/11 and 2015/16. New admissions for clients in treatment for problematic use of cannabis and other substances were stable, but the number of clients in the total caseload increased. Proportions of daily cannabis use increased among all clients in treatment for problematic cannabis use. These findings are representative of clients with problematic cannabis use who receive nonmedical, community-funded addiction treatment services in Ontario.
As cannabis use becomes more accepted as normative behaviour, fewer people are in treatment for problematic cannabis use, but the frequency of cannabis use by clients receiving treatment is increasing. Importantly, the frequency of cannabis use is an established predictor of cannabis use disorder and it is associated with dependence severity.19,20 These findings may show that cannabis use treatment that is unnecessary from a clinical standpoint is being reduced; in other words, fewer people may be receiving treatment mainly for occasional or moderate cannabis use that does not pose significant risks. This explanation is supported by our observation of decreases in the proportions of clients who were receiving mandated treatment. Corroborating this explanation are observations from the United States, where cannabis use has been increasing but the rate of cannabis use disorder among cannabis users has been decreasing.21 However, alternative explanations cannot be ruled out. It is conversely possible that increased acceptance of cannabis use as normative behaviour may be affecting the patterns of usage or leading to accurate reporting of usage because there is less perceived stigma than in the past. Although both phenomena would be associated with increases in the frequency of cannabis use, there are differences in the implications, as the former would suggest actual increases in frequency and the latter would suggest no changes in frequency. The characteristics of clients in treatment for problematic cannabis use have also changed. Fewer of these clients have less than secondary school education and are students or retraining, whereas the age of clients has increased overall. Such changes should be continually monitored so that treatment programming can be adequately tailored to the needs of clients.
Earlier data, primarily on new admissions, from the Drug and Alcohol Treatment Information System have been analyzed to obtain insights into treatment for problematic cannabis use. Urbanoski and colleagues showed that there were 14 633 clients (31% of all clients) in treatment for problematic cannabis use in 2000/01, with 6219 of these clients (13% of all clients) identifying cannabis as the primary substance.9 However, the database has undergone considerable changes since then, limiting the comparability of those findings with our results. Rotondi and Rush later demonstrated that the number of clients in treatment for problematic cannabis use increased from 16 351 clients in 2005/06 to 17 854 clients in 2009/10.14 Notably, minor decreases in the number of clients were observed in their study between 2008/09 and 2009/10.14 The National Treatment Indicators reports compile data from publicly funded addiction treatment systems in Canada. These reports showed that problematic cannabis use as the primary problem in Ontario decreased from a little over 30% among all treatment admissions in 2012/13 to 20% in 2013/14. These estimates did not account for multiple admissions per client and were relative to the proportions of all admissions.15,16
Limitations
The data in our study were susceptible to social desirability, recall and misclassification biases. The first 2 biases may have resulted from the self-reported nature of the data. However, this impact was expected to be minimal because these were clients already in treatment. Group classification on the basis of clients’ self-reports of problematic substance use rather than clinical diagnoses or biological confirmation (e.g., blood or urine measurements) may have resulted in misclassification bias. As validation studies have not been conducted to assess the reliability or validity of the data, the potential of misclassification is particularly of concern. In one relevant scenario, some clients reported no cannabis use despite being in treatment for problematic cannabis use. These clients may have continued with treatment to maintain prior gains, but the weaknesses of self-reported and health administrative data must be acknowledged. Furthermore, private, self-help and pharmacotherapeutic services were not included, resulting in potential underestimation of treatment for problematic cannabis use. The extent of the underestimation is not known, as comprehensive data on additional treatment services are not available. The services included in the study were also quite heterogenous. As further subgroup analyses were not undertaken, it is not known if the findings differed by types of services. The adoption of the fifth edition of the Diagnostic and Statistical Manual of Mental Disorders may also have affected the client flow into the addiction treatment system, such as through increased referrals from physicians, but it was not possible to determine the extent or direction of this impact.
Conclusion
The impact of cannabis legalization in Canada on treatment for cannabis use disorder needs to be monitored in the long term. The present findings show decreases in treatment for only problematic cannabis use in Ontario from 2010/11 to 2015/16 but increases in the frequency of cannabis use for all clients in treatment for problematic cannabis use. These findings may suggest that unnecessary treatment for cannabis use has been reduced. As such, alignment of treatment programming with disorder severity may be warranted.
Footnotes
Competing interests: None declared.
This article has been peer reviewed.
Contributors: Sameer Imtiaz and Jürgen Rehm conceived the idea for the study. Sameer Imtiaz, Paul Kurdyak, Andriy Samokhvalov and Jürgen Rehm outlined the design. Sameer Imtiaz, Bill Que and Daniel Elliot managed the data acquisition. Sameer Imtiaz conducted the data analyses, with assistance from Mahhum Mumtaz Mobashir. Sameer Imtiaz drafted the manuscript. All authors critically revised it for intellectual content and gave final approval of the version to be published. All authors agreed to be accountable for all aspects of this research.
Funding: This study received no specific funding. Sameer Imtiaz was supported by the Queen Elizabeth II/H. David Archibald Graduate Scholarship in Science and Technology.
Supplemental information: For reviewer comments and the original submission of this manuscript, please see www.cmajopen.ca/content/6/4/E495/suppl/DC1.
References
- Copyright 2018, Joule Inc. or its licensors
In this issue

Article tools


Related Articles
Cited By...
- No citing articles found.