


Article Figures & Tables
Figures
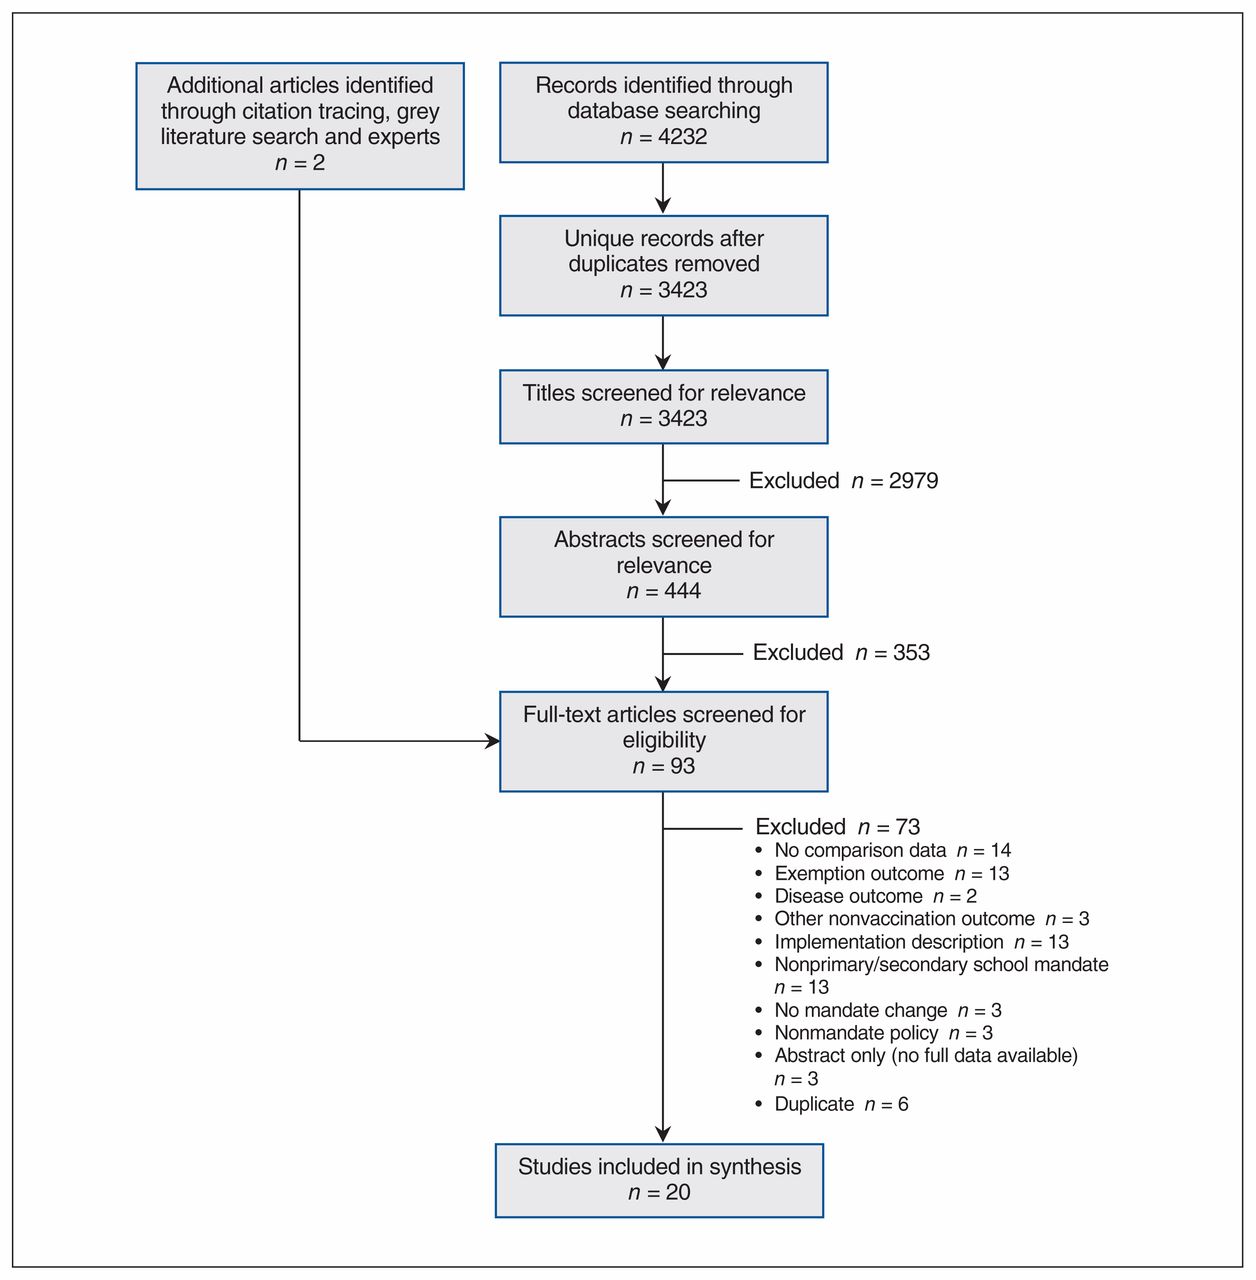
- Figure 1:
Flow diagram showing study selection.

Tables
Investigator/year Setting Method Data source (population) Mandate change studied (year) Outcome of interest Main findings Averhoff et al., (23) 2004 San Diego, Calif., US Uncontrolled before–after study using survey data Random-digit-dial telephone survey in 1998 (n = 205) and 1999 (n = 378) 7th grade hepatitis B and MMR mandate (1999) 3-dose hepatitis B and 2-dose MMR In year mandate took effect, 7th grade students more likely to be vaccinated than other cohorts not subject to mandate
Effect was larger for hepatitis B, which had lower uptake before mandate
No other factors found to be significantly associated with being vaccinated
Bugenske et al., (24) 2012 US Retrospective analysis of data from cross-sectional vaccination coverage survey NIS-Teen 2008–2009 (landline only, provider-verified records only) (2008 n = 17 835; 2009 n = 20 066) Middle school vaccination mandate (2008–2009) Increase in coverage of Tdap, HPV and MCV vaccines, and increase of all recommended vaccines in adolescents 13–17 yr of age Tdap and MCV coverage increased from 2008 to 2009 in all states
States with existing or new mandates had higher coverage of Tdap and MCV than states without mandate; however, coverage did not differ among states with new and old mandates
HPV and MenACWY coverage did not differ in states with educational requirements compared to states without educational requirements (no states had educational requirements for Tdap)
Presence of vaccine mandates was not associated with increase in up-to-date status for all vaccines
Carpenter et al., (25) 2019 US Difference-in-differences analysis based on retrospective analysis of data from cross-sectional vaccination coverage survey NIS-Teen 2008–2013 (including cellphone from 2011 onward) (n = 116 403) Middle school Tdap vaccination mandate (2005–2015) Increase in Tdap coverage at age 10–13 yr in states with Tdap mandates Tdap uptake about 13% higher in states with mandates, with spillover effects to other vaccines (HPV and MCV) Cuff et al., (26) 2016 Virginia, US Prospective cohort study using administrative data and telephone survey University of Virginia Clinical Data Repository 2014 (n = 908 girls) 6th grade HPV mandate for girls (2009) HPV vaccine initiation (≥ 1 dose) in girls 11–12 yr of age and proportion vaccinated in 2009 and 2014 cohorts Mandate had no effect on HPV coverage 5 yr after mandate implementation D’Ancona et al., (20) 2018 Italy Uncontrolled before–after study of administrative data Administrative information database collected by local health units for the Ministry of Health 2013–2017 (entire population; n unspecified) Increase from 4 to 10 required vaccines; imposition of fines up to age 16 yr and exclusion up to age 6 yr for noncompliance (2017) Polio and measles vaccine by age 7 yr Early results indicated slight increase in 2017; statistical significance of change and trends not tested
Increases in uptake of some vaccines among younger children as well
Jackson et al., (39) 1972 Oklahoma, US Uncontrolled before–after study of administrative data 1st grade students in 33 randomly selected counties (n = 8762) School entry mandate for diphtheria, tetanus, pertussis, measles and rubella (1970) 3 doses DTP and orally administered polio, 1 dose rubella and measles or record of disease, smallpox vaccine Increase in vaccination completion in first year of mandate, including for nonmandated smallpox; statistical significance of change not tested Jacobs et al., (27) 2004 US Cohort study using clinical data sample Practices (n = 53) recruited through mailing to doctors in AMA master file and enrolling first practices to respond; 20 adolescent patients (11–15 yr) per pediatric or general practice (n = 982 patients) Middle school entry hepatitis B mandates (pre-2000) Completion of 2- or 3-dose hepatitis B series Presence of mandate was strongest predictor of completion of hepatitis B series Karikari et al., (28) 2017 Illinois, US Uncontrolled before–after study of administrative data Illinois State Board of Education database 2012–2013 and 2014–2015 (n = 1 151 993) and CDC survey data from 2012–2014 (n not unspecified; data source unclear) Tdap mandate for 6th–12th grade (2013) Adolescent Tdap vaccination Both data sources showed higher Tdap coverage after the mandate, although numbers varied greatly between the 2 data sources Kharbanda et al., (32) 2010 New York, NY, US Uncontrolled before–after study using administrative data from a clinical network EzVAC, a hospital- and clinic-based vaccination registry, 2006–2008 (n = 2577) 6th grade entry Tdap mandate (2007) Tdap and MCV4 coverage in 11- to 14-year-olds enrolled in EzVAC network Tdap coverage increased in both years after mandate, including some shift from Td to Tdap
MCV4 coverage (nonmandated) also increased
Morita et al., (29) 2008 Chicago, Ill., US Uncontrolled before–after study of administrative data Chicago public schools’ vaccination database 2000–2005 (n = 106 541) 5th grade hepatitis B mandate (1997) Hepatitis B coverage by grade 12 (overall, and racial/ethnic disparities in coverage) Postmandate cohorts had higher hepatitis B coverage rates than premandate cohorts
Disparities in coverage rate by race and ethnicity also decreased after mandate
Moss et al., (30) 2016 US Retrospective analysis of data from cross-sectional vaccination coverage survey NIS-Teen 2009–2012 (unspecified whether provider-verified or all, or whether cellphone included from 2011 on) (n = 99 921) Middle school Tdap, MCV and HPV mandates (various) Adolescent (13–17 yr) coverage of Tdap booster and MCV, and HPV among girls (1-dose series) Tdap and MCV mandates were associated with higher coverage of those vaccines and also of HPV for girls
HPV mandates had no effect
Olshen et al., (31) 2007 27 US states + DC Cross-sectional study Health Plan Employer Data and Information Set 2003 (n = 100 000) Mandates for hepatitis B and varicella before 2003 (various) Policy attribute that is associated with higher mean coverage Mandate policy at middle school level was associated with higher mean hepatitis B and varicella coverage
Other policy attributes (e.g., exemptions, payment and deductibles, universal purchasing) not associated
Omer et al., (22) 2018 Washington State, US Uncontrolled before–after study using administrative data Washington State Department of Health 1997–1998 to 2013–2014 (n not reported) New procedures requiring certificate signed by health care provider for medical exemptions (2011) Kindergarten vaccination rates Vaccination rates for each vaccine stayed the same or increased slightly after the policy
Proportion of students up to date for all vaccines increased
Perkins et al., (33) 2016 US Retrospective analysis of data from cross-sectional vaccination coverage survey NIS-Teen 2009–2013 (provider-verified responses only; unspecified whether cellphone included from 2011 on) (n = 47 845 parents of girls) Middle school HPV mandate for girls (DC, Virginia) and HPV education mandate (Louisiana, Michigan, Colorado, Indiana, Iowa, Illinois, New Jersey, North Carolina, Texas, Washington) (various) HPV vaccine coverage (series initiation, completion) in girls No difference in HPV coverage between girls in states with school entry vaccine mandates or education mandates compared to no mandates Pierre-Victor et al., (34) 2017 Virginia, Tennessee, and South Carolina, US Retrospective analysis of data from cross-sectional vaccination coverage survey NIS-Teen 2008–2012 (landline only; excluding those who did not respond about HPV) (n = 3203 parents of girls) Middle school HPV mandate for girls (Virginia) (2009) HPV vaccine initiation Trends were not different in Virginia with mandate compared to Tennessee and South Carolina without mandate Potter et al., (35) 2014 Michigan, US Uncontrolled before–after study using administrative data Michigan Care Improvement Registry (statewide vaccination registry) 2009 and 2010 (2009 n = 133 738; 2010 n = 131 051) New mandate at 6th grade entry for Tdap, MCV4, varicella (2010) Completion of all required vaccines (as a single variable); time to completion (up-to-date status) of all required vaccines; initiation of HPV vaccine (girls only) Vaccine completion (up to date for all) was higher in year after mandate, and time to completion was shorter Simpson et al., (36) 2013 Arizona, US Uncontrolled before–after study using administrative data Arizona State Immunization Information System 2006–2011 (n = 954 953 records) New mandate for MCV4 for 6th grade entry if aged ≥ 11 yr (2008) MCV4 coverage Vaccine coverage for 12-year-olds was higher after mandate than before mandate Thompson et al., (21) 1994 Victoria, Australia Uncontrolled before–after study using administrative data Victoria Directorate of School Education mid-year census 1991 and 1992 (1576 schools included; 1992 n = 45 049 students) Documentation mandate for school entry (1992) Submitted documentation of immunization status; documentation of complete (up-to-date) vaccination for age Small increase in submitted documentation after policy mandate, including small increase in documentation of fully vaccinated students and larger increase in documentation of incompletely vaccinated students Thompson et al., (37) 2018 Rhode Island, US Retrospective analysis of data from cross-sectional vaccination coverage survey NIS-Teen 2010–2016 (unspecified whether cellphone included from 2011 on; parent report only) (n unspecified) HPV mandate for initiation by 7th grade and completion by 9th grade (2015) Initiation of HPV series Only initiation in boys showed small increase after mandate; no change among girls
No increase among boys in other states
Wilson et al., (38) 2005 Kansas City, Mo., and Kansas City, Kan., US Retrospective cohort study of school samples Random sample of vaccine records from purposive sample of 11 high schools in 2003 (n = 2230) Hepatitis B mandate for elementary school (1997) and middle school (1999) (Missouri) 3 hepatitis B vaccine doses at 9th grade Students affected by middle school hepatitis B mandate were more likely to have been vaccinated than earlier cohort in same area or contemporaries in comparison area without mandate
No spillover differences observed for MMR or Td vaccines
Note: AMA = American Medical Association, CDC = Centers for Disease Control and Prevention, MCV = meningococcal vaccines, MenACWY = meningococcal conjugate vaccine for protection against serogroups A, C, W and Y, MMR = measles/mumps/rubella, NIS-Teen = National Immunization Survey-Teen, (40) Td = tetanus/diphtheria, Tdap = tetanus/diphtheria/acellular pertussis.
Investigator Confounders, including cointerventions (ecological fallacy, confounding) Bias in comparison groups (selection bias) Data collection issues and missing data (selection bias, nonresponse bias, information biases including recall bias and reporting bias) Lack of detail regarding intervention or implementation (bias due to deviation from or variation in interventions) Outcome assessment methods or measures (measurement bias) Averhoff et al. (23) No measurement or adjustment for important potential confounders (e.g., home learning rates, noncompliance) – Self-reported vaccination data from single school district; response rate unknown Exemption process, consequences for noncompliance and other implementation factors not specified No external verification of vaccination status Bugenske et al. (24) Ecological study
No measurement or adjustment for important potential confounders
May have been unobserved differences in individuals between states with and without mandates Analysis limited to landline telephones and responses accompanied by provider-verified records; may not be representative Policies were grouped together, not allowing for analysis of subtle differences in implementation or context Follow-up time for policies limited; up-to-date vaccination status defined as 1 dose Carpenter et al. (25) Ecological study May have been unobserved differences in individuals between states with and without mandates
Age groups as proxy for middle school enrolment may not reflect actual grades affected by mandates in every state
Used 2008 data as proxy for premandate 2004/05 vaccination status; no middle school enrolment data; no premandate data Multiple state policies grouped together; no accounting for differences – Cuff et al. (26) No measurement or adjustment for important potential confounders – Single-centre study; low response rate; participants included only parents seeking care for well-child care visits; may not be representative – Only 1 yr of baseline (premandate) data D’Ancona et al. (20) Ecological study
Media campaign cointervention not accounted for
– – – Lack of reliable denominator; no testing for statistical significance of changes; only 1 yr of postmandate data Jackson et al. (39) Ecological study
Known cointerventions included awareness campaigns to public and doctors, improving access through increased clinic days and free vaccines, special measles vaccination campaign in preintervention year, rubella vaccine shortage in preintervention year; effects not measured separately
– Convenience sample of schoolchildren (not random) from a random sample of school districts – No external verification of vaccination status (parent report); no testing for statistical significance of changes; only 1 yr of pre- and postmandate data Jacobs et al. (27) Ecological study May have been unobserved differences in individuals between states with and without mandates Convenience sample of pediatric and family practices; adolescents enrolled only after visiting doctor; 7% excluded owing to incomplete records; unclear how representative this clinical sample is of population
Lack of clarity regarding data collection timelines
Policies grouped together, not allowing for analysis of subtle differences in implementation or context – Karikari et al. (28) Ecological study
No measurement or adjustment for important potential confounders
– Included only school-enrolled children in vaccination registry; 2 different data sources for outcome had different results; unclear why differences existed; lack of detail on CDC survey No information on implementation or context Unknown to what extent findings can be extrapolated to larger population Kharbanda et al. (32) No measurement or adjustment for potential confounders, although did look at spillover effect on nonmandate vaccination – Population from system of only 1 hospital; not representative of larger population; may not be generalizable
Data missing on any vaccines given outside participating hospital system
Only included those with sufficient vaccination information
No information on implementation or context – Morita et al. (29) Ecological study – Losses to follow-up (e.g., students leaving school) excluded from analysis Likely inconsistent enforcement of policy, not captured by study data collection methods Only 2 yr of postmandate data Moss et al. (30) Ecological study
No measurement or adjustment for important potential confounders
May have been unobserved differences in setting between states with and without mandates – Likely inconsistent enforcement of policy, not captured by study data collection methods Unspecified/unadjusted for state differences in age/grade of mandate Olshen et al. (31) Ecological study May have been differences in population with study insurer and population as a whole (representativeness and generalizability) – Policies grouped together, not allowing for subtle differences in implementation or context Full model information not provided Omer et al. (22) Other known changes (e.g., in vaccination schedule, exemption forms) before policy change appear to have affected trends – Home learners may not have been included – – Perkins et al. (33) Ecological study May have been unobserved differences in setting between states with and without mandates Included only respondents with adequate provider-verified vaccination history Policies grouped together, not allowing for subtle differences in implementation or context Only 1 yr of baseline (premandate) data Pierre-Victor et al. (34) Ecological study May have been unobserved differences in setting between states with and without mandates Landline-only sample; analysis included only those who responded about HPV – – Potter et al. (35) Ecological study – Home learners may not have been included – Only 1 yr of baseline (premandate) and follow-up (postmandate) data Simpson et al. (36) Ecological study
No measurement or adjustment for important potential confounders; known potential confounders include 2005 ACIP recommendation and education/awareness campaign that accompanied mandate
– Comparison with census data indicates registry may have underestimated coverage – – Thompson et al. (21) Ecological study – Data not available from nongovernmental schools; only schools with kindergarten enrolment included Not possible to know reason for missing documentation, so unclear whether this represents bias in coverage outcome; some schools may have been more compliant than others Limited pre- and postmandate data Thompson et al. (37) Ecological study
No measurement or control for potential confounders
Insurance coverage for HPV for boys in other states unknown and may have confounded uptake
“All other states” comparator includes states both with and without mandates Parent report only (no provider verification) Implementation details not specified other than difficult to opt out Only 1 yr of postmandate data Wilson et al. (38) Many cointerventions described; no measurement or control for potential confounders Small school-based population may not be representative; combination of random and purposive sampling; 1 school excluded owing to improper documentation; nonenrolled students excluded (potential selection bias; enrolment in rural areas below target – Implementation details not specified Small sample, insufficient statistical power Note: ACIP = Advisory Committee on Immunization Practices, CDC = Centers for Diseases Control and Prevention, HPV = human papillomavirus.
In this issue

Article tools


