


Article Figures & Tables
Figures
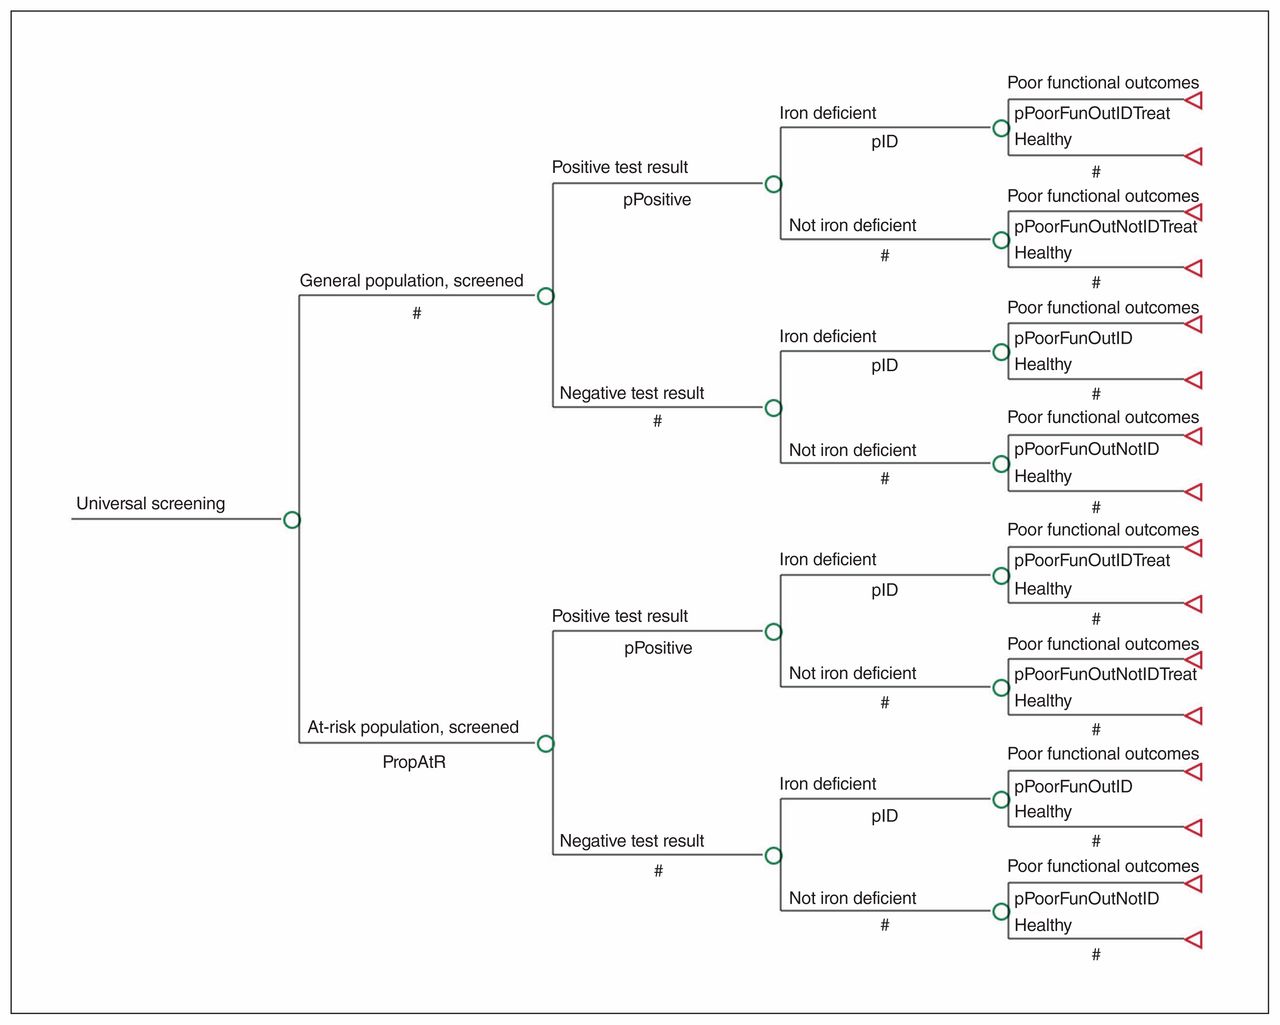
- Figure 1:
Decision tree model (universal screening branch only; full decision tree is available in Appendix 1, Supplemental Figure 1, available at www.cmajopen.ca/content/7/4/E689/suppl/DC1).
- Figure 2:
One-way sensitivity analyses comparing (A) universal screening versus no screening, (B) targeted screening versus no screening and (C) universal screening versus targeted screening. Note: EV = expected value (equivalent to the base-case incremental cost-effectiveness ratio [ICER]), ID = iron deficiency, prob = probability.
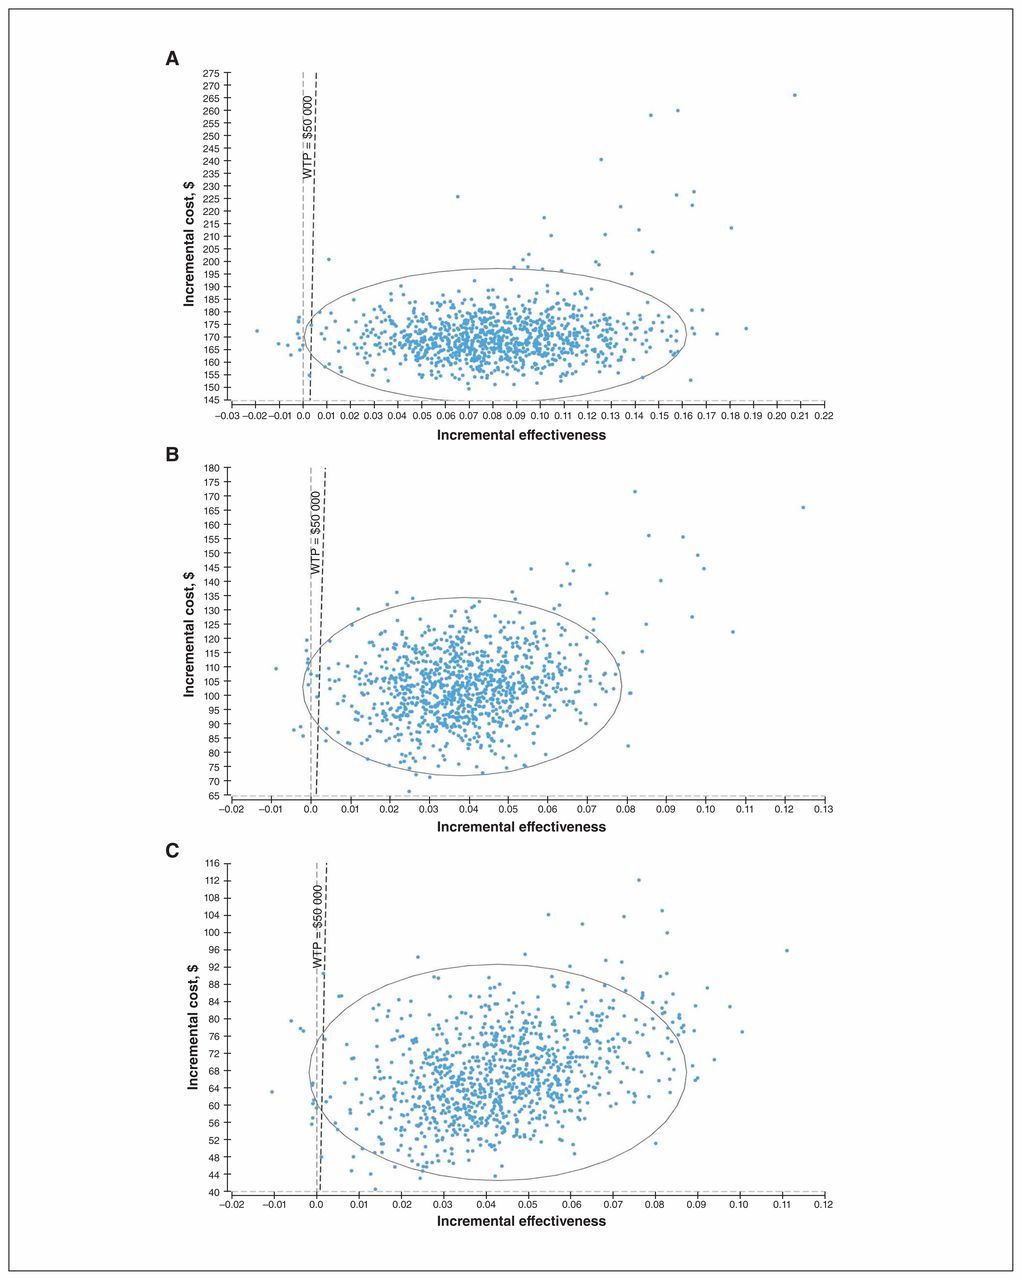
- Figure 3:
Probabilistic sensitivity analyses results comparing (A) universal screening versus no screening, (B) targeted screening versus no screening and (C) universal screening versus targeted screening. Note: WTP = willingness to pay.


Tables
Parameter Base case Data source/reasoning Prevalence of iron deficiency General population 12.1% Hartfield 2010 (21) (review of 10 studies) At-risk population 25.0% Optimizing Early Child Development study (13) data, Oatley et al., 2018 (15) (n = 1735) Proportion of children at risk in general population 35.5% Optimizing Early Child Development study (13) data (≥ 2 risk factors*) Probability of poor functional outcomes Untreated Due to iron deficiency 23.5% Lozoff et al., 2000 (6) (longitudinal cohort study, n = 167) Not due to iron deficiency 9.5% Idjradinata et al., 1993 (12) (randomized controlled trial stratified by iron status; iron-deficiency anemia n = 50, nonanemic iron deficiency n = 29, iron sufficiency n = 47) After iron supplementation treatment Due to iron deficiency 9.5% Idjradinata et al. (12) Not due to iron deficiency 9.5% Idjradinata et al. (12) Screening test efficiency Sensitivity 58.6% Guyatt et al.,1992 (22) (review of 55 studies) Specificity 98.9% Guyatt et al. (22) Utility parameter inputs Utility of having iron supplementation treatment (utilityTreat) 0.815 Accounting for potential side effects (constipation) of receiving iron supplementation, NICE 2010 (23) Utility of living with poor functional outcomes (utilityPoorFunOut) 0.84 Assuming children will experience utility loss owing to cognitive impairment
Bennett et al., (24) 2000 (computer-based utility assessment interview, n = 94)
Ekman et al., (25) 2007 (cross-sectional study, n = 1800)Note: NICE = National Institute for Health and Care Excellence.
↵* Include younger age, longer breast-feeding duration, high body mass index z-score and drinking more than 500 mL of cow’s milk per day.
Terminal node health state Formula Reasoning Healthy, untreated 
Assuming screening occurs at 18 months and health state is experienced for all years following test (using life expectancy of 82 yr (37)) Healthy, after treatment
Assumes there is some decrease in utility for 4 mo during iron supplementation (4/12 mo = 0.33) Poor functional outcomes, untreated
Assumes that iron deficiency is not detected and treated, and resulting health state is experienced for all years following test Poor functional outcomes, after treatment
Assumes that iron deficiency is not treated despite supplementation, and this health state experiences both decreased utilities from poor functional outcomes, and short-term decrease in utility due to supplementation Note: QALY = quality-adjusted life year.
Parameter Base case, $ Data source/reasoning Universal screening Adjusted laboratory costs Laboratory services 10.67 OHIP Schedule of Benefits for Laboratory Services (complete blood count, ferritin and C-reactive protein)* Administration 6.37 Ontario Nurses Association (assuming 10-min nursing time)† Patient documentation and specimen collection fee 10.76 OHIP Schedule of Benefits (urban location) Total (uninflated) 28.48 (27.80) Inflated to value as of January 2019 using the monthly Canadian Consumer Price Index‡ Patient-borne cost Salary loss 103.21 Average weekly wages for Canadians (permanent employees) were $1032.12 in January 2019. (40) In the base case, 1 parent is assumed to take 0.5 d off work. Travel expense 13.12 1 parent driving conventional vehicle to screening location (15 km round trip). Fuel consumption is 7.8 L/100 km§ and cost of regular gasoline is $0.96/L,¶ for a total cost for gasoline of $1.12. In the base case, a 1-hour parking time is assumed at $6 per 30 min,** for a parking cost of $12. Total 116.33 Total cost 144.81 Targeted screening Adjusted laboratory costs Laboratory services 10.67 As above Administration 12.73 As above Patient documentation and specimen collection fee 10.76 As above Total (uninflated) 35.00 (34.16) Inflated to value as of January 2019 using the monthly Canadian Consumer Price Index‡ Patient-borne cost Salary loss 103.21 As above Travel expense 13.12 As above Total 116.33 Total cost 151.33 Treatment cost (ferrous sulfate, 4 mo) 170.00 $168.63 including dispensing fee (44) Note: OHIP = Ontario Health Insurance Plan.
↵* As of Apr. 1, 2017: complete blood count $3.98, ferritin $2.97, C-reactive protein $3.72.
↵† Using an hourly rate of $38.19 for full-time registered nurse with 5 years’ experience (effective Apr. 1, 2017). (38)
↵‡ April 2017: 130.4; January 2019: 133.6. (39)
↵§ Fuel consumption ratings by Natural Resources Canada using the measures of the Honda Civic coupe, Canada’s best-selling car for 21 consecutive years. (41)
↵¶ Ontario gasoline price on Feb. 11, 2019. (42)
↵** Parking rate at The Hospital for Sick Children, Toronto. (43)
Strategy Cost, $ Effect, QALYs Incremental cost Incremental effect, QALYs ICER 2 screening programs v. no screening No screening 0.00 23.82 – – – Targeted screening 63.06 23.86 63.06 0.04 1676.94 Universal screening 162.98 23.89 162.98 0.07 2286.06 Universal screening v. targeted screening Targeted screening 63.06 23.86 – – – Universal screening 162.98 23.89 99.92 0.03 2965.96 Note: ICER = incremental cost-effectiveness ratio, QALY = quality-adjusted life year.


In this issue

Article tools


Related Articles
Cited By...
- No citing articles found.