


Article Figures & Tables
Figures
- Figure 1:
Structure of adapted Markov cohort cost-utility model. The clinical stages of mechanical ventilation (MV) are shown in (A). The model begins once the patient has completed the acute phase of ventilatory support and enters the recovery phase. The model is shown in (B). Patients receiving MV are either synchronous or asynchronous with the ventilator. Those who are synchronous can become asynchronous and vice versa. Patients receiving MV are at risk for ventilator-associated pneumonia (VAP). From MV, patients undergo a spontaneous breathing trial (SBT), which, if successful, results in liberation (extubation and removal from invasive MV). After liberation, patients are transferred to lower-acuity care (general ward [GW]) and later discharged home. If there is patient compromise after extubation (extubation failure), the endotracheal tube is reinserted and MV reinstituted. At any stage, patients may die. Note: ICU = intensive care unit, PAV+ mode = proportional-assist ventilation with load-adjustable gain factors, PSV = pressure-support ventilation.
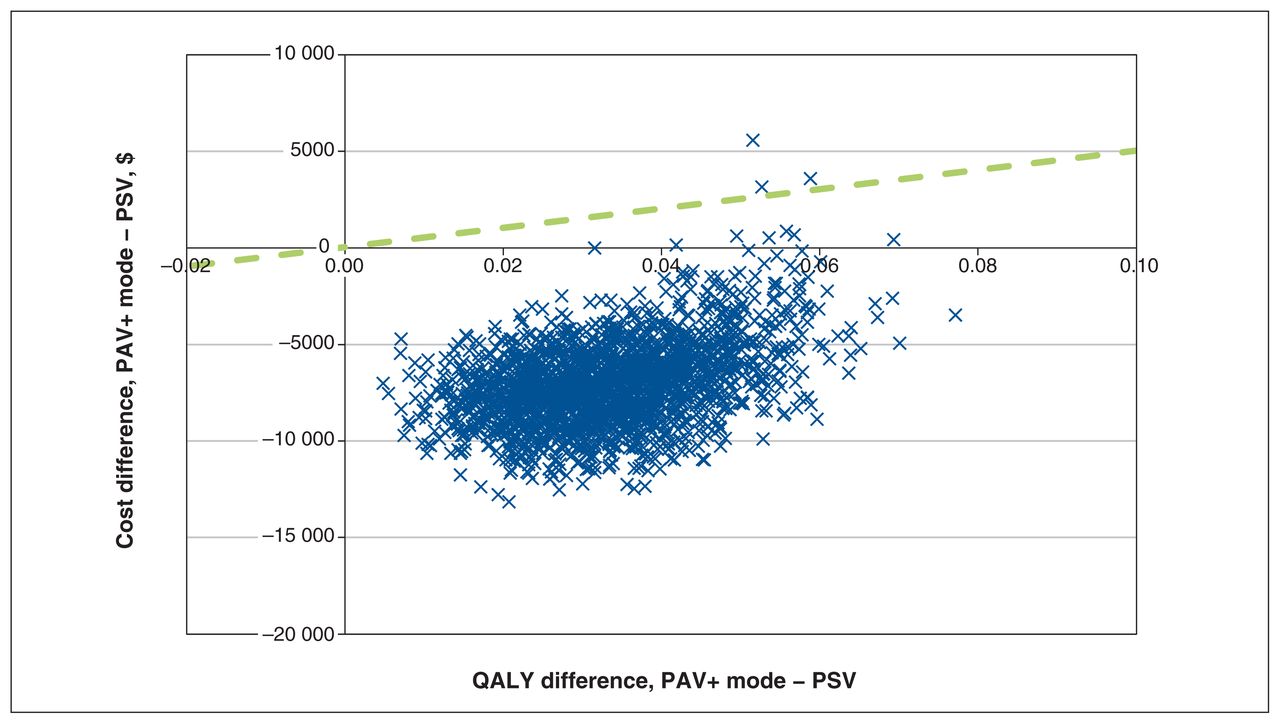
- Figure 2:
Cost-effectiveness plane for proportional-assist ventilation with load-adjustable gain factors (PAV+ mode) versus pressure-support ventilation (PSV). The dashed green line (reference) indicates a willingness-to-pay threshold of $50 000 per quality-adjusted life year (QALY) gained. Points underneath this line are considered cost-effective. Simulations in the lower right quadrant (increase in QALY, decrease in cost) are considered dominant. Costs are in 2017 Canadian dollars.
- Figure 3:
Cost-effectiveness acceptability curve at 2 time horizons for proportional-assist ventilation with load-adjustable gain factors versus pressure-support ventilation. The proportion of simulations is shown according to varying thresholds of cost-effectiveness for a 1-year hospital-payer perspective and a 20-year public-payer perspective. Cases where the result was dominant (a decrease in costs accompanied by an increase in quality-adjusted life years) are counted among the cost-effective scenarios, hence the curves’ indicating nonzero proportions of simulations as cost-effective even at a willingness-to-pay threshold of $0. Costs are in 2017 Canadian dollars.


Tables
Parameter Base case Distribution† Patient cohort demographic characteristics Age, mean ± SD, yr 67 ± 12 (15) Normal Female sex (SE), % 39.7 (0.13) (33) β Patient outcomes in acute phase of mechanical ventilation‡ Patients with clusters of ineffective efforts, mean (estimated 95% CI), % 38 (29.1 to 47.3) (33) β Patient asynchrony on entering model‡ Asynchrony > 10% at initiation of mechanical ventilation if clusters of ineffective efforts, % ± SD 8.5 ± 1.8 (33) β Asynchrony > 10% at initiation of mechanical ventilation if no clusters of ineffective efforts, % ± SD 1.5 ± 1.0 (33) β Reference efficacy standard of care (PSV), mean (95% CI) Duration of mechanical ventilation, d 8.1 (4.5 to 28.3) (34) Normal Time in intensive care unit, d 12.6 (7.4 to 33.3) (34)§ Normal Time in hospital, d 43.5 (18.6 to 68.4) (34)§ Normal Spontaneous breathing trial success, % 77.9 (73.8 to 82.1) (23) β Liberation success, % (95% CI) 85.3 (85.1 to 85.6) (35) β Adverse event rates, mean (95% CI), % Tracheostomy 26.0 (8.1 to 44.0) (15) β Ventilator-associated pneumonia 8.8 (5.7 to 11.9) (34) β Nosocomial infection 0.85 (0.66 to 1.04) (36) β Intensive care unit death 25.4 (20.7 to 30.1) (34) β Hospital death 30.3 (25.3 to 35.3) (34) β Postdischarge death Year 1 12.5 (12.4 to 12.6) (37) β Year 2 19.3 (19.2 to 19.5) (37)¶ β Year 3 27.5 (27.3 to 27.7) (37)¶ β Year 4 onward Life tables¶ β Comparative effectiveness, PAV+ mode v. PSV** Total duration of mechanical ventilation, mean (95% CI), d −1.53 (−2.24 to −0.83) Normal Intensive care unit length of stay, mean (95% CI), d −1.54 (−2.19 to −0.90) Normal Hospital length of stay, mean (95% CI), d −1.83 (−2.51 to −1.16) Normal Successful weaning/liberation, OR (95% CI) 1.49 (0.59 to 3.79) Log-normal Intensive care unit death, OR (95% CI) 0.70 (0.41 to 1.20) Log-normal Hospital death, OR (95% CI) 0.70 (0.40 to 1.22) Log-normal Tracheostomy, OR (95% CI) 0.76 (0.44 to 1.31) Log-normal Extubation failure/reintubation, OR (95% CI) 0.52 (0.25 to 1.08) Log-normal Asynchrony index ≥ 10, OR (95% CI) 0.13 (0.07 to 0.23) Log-normal Costs†† Intensive care unit, cost per day, mean (range of reported means), $ 2765 (2354–3690) (38) γ General ward, cost per day, mean (range of reported means), $ 019 (717–1400) (38) γ Mechanical ventilation initiation, cost per event, mean (95% CI), $ 139 (125 to 153) (39) γ Mechanical ventilation maintenance, cost per day, mean (95% CI), $ 851 (766 to 936) (39) γ Tracheostomy, cost per event, mean (95% CI), $ 4193 (3908 to 4477) (40) γ Ventilator-associated pneumonia, cost per day, mean (95% CI), $ 58 (30 to 73) (41), (42) γ Other nosocomial infection, cost per event, mean (± 10%), $ 870 (783 to 956) (43) γ PSV, purchase cost, $ 0‡‡ γ PAV+ mode, 1-time purchase cost, $ 27 000 (22)§§ γ After discharge, annual cost, mean (95% CI), $ Year 1–2 13 707 (6241 to 37 631) (44)¶ γ Year 3 onward 10 032 (5835 to 17 169) (44)¶ γ Ventilator-associated pneumonia, additional length of stay, median (range), d 9.5 (8.8–10.1) (27) Normal Health state utility, mean (95% CI) Baseline 0.776 (0.677 to 0.899) (22) Normal Mechanical ventilation −0.390 (−0.590 to 0.090) (22) Normal Intensive care unit 0.402 (0.362 to 0.442) (22) Normal Hospital 0.520 (0.450 to 0.590) (22) Normal After discharge to 1 yr 0.550 (0.480 to 0.610) (22) Normal Adverse event disutility Tracheostomy 0¶¶ Normal Ventilator-associated pneumonia 0*** Normal Extubation failure 0¶¶ Normal Note: CI = confidence interval, OR = odds ratio, PAV+ mode = proportional-assist ventilation with load-adjustable gain factors, PSV = pressure-support ventilation, SD = standard deviation, SE = standard error.
↵* Canadian data in italics.
↵† We made the choice of distribution to reflect the uncertainty of each parameter from the perspective of population-level uncertainty as opposed to uncertainty at the individual patient level.
↵‡ See Figure 1.
↵§ In the analysis by Sinuff and colleagues, (34) no upper bound was presented owing to the patient’s remaining in hospital. For our calculations, we assumed that the upper bound is given by: mean + (mean – lower bound).
↵¶ Used for scenario analyses only.
↵** Seven clinical studies comparing PAV+ mode to PSV (15)– (17), (23)– (26) were identified by K.J.B. and in systematic reviews. (45), (46) As these systematic reviews did not report on all required outcomes, and no single study presented robust clinical data on the required model inputs, we determined the comparative efficacy of PAV+ mode versus PSV by means of a pragmatic meta-analysis (Appendix 1).
↵†† 2017 Canadian dollars.
↵‡‡ Conservative assumption.
↵§§ Assumed to be $24.64 per day of use, assuming a 5-year life cycle and that the ventilator is in use on 60% of days. Probabilistic model inputs (used for the probabilistic sensitivity analysis) were based on input variance, calculated from reported CIs.
↵¶¶ Assumed none in addition to mechanical ventilation.
↵*** Additional duration of mechanical ventilation is assumed to cover the disutility.
Scenario Cost difference, $ QALY difference ICER Base case (default values) −7643 0.04 Dominant Only significant differences in comparative effectiveness included −7423 0.02 Dominant Long-term time horizon (20 yr, public-payer perspective)‡ 6110 0.92 $6624 Younger patient population (50 yr) 7643 0.04 Dominant Patient population 70% female −7643 0.04 Dominant No difference in asynchrony between PAV+ mode and PSV −6658 0.03 Dominant PSV also has purchase cost ($13 500) −7761 0.04 Dominant Per-day total hospital costs: intensive care unit $3592, general ward $1135 (28) −9408 0.04 Dominant Per-day direct hospital costs: intensive care unit $1732.90, general ward $499.70 (29) −5832 0.04 Dominant Canadian efficacy data only (15) −8080 0.00 Cost saving Alternative RR for successful spontaneous breathing trial, OR 1.16 (47) −7123 0.03 Dominant Alternative utility value assumed for mechanical ventilation, 0.29 (22) −7643 0.03 Dominant Note: ICER = incremental cost-effectiveness ratio, OR = odds ratio, PAV+ mode = proportional-assist ventilation with load-adjustable gain factors, PSV = pressure-support ventilation, QALY = quality-adjusted life year, RR = relative risk.
↵* Results are presented as PAV+ mode versus standard-care PSV, with difference in costs over difference in QALYs. The associated ICER is shown; in cases in which costs decrease and QALYs increase, the ICER is taken as dominant.
↵† Costs in 2017 Canadian dollars.
↵‡ Costs and quality of life utilities (measured with the EuroQoL EQ-5D instrument (32)) incurred after the first year are discounted at 1.5% per annum, in line with CAFTH guidelines. (30) Annual utility decrements are also applied in the model after the first year.
In this issue

Article tools


Related Articles
Cited By...
- No citing articles found.