


Abstract
Background: Assessment of potential geographic variation in quality indicators of atrial fibrillation care may identify opportunities for improvement in the quality of atrial fibrillation care. The objective of this study was to assess for potential geographic variation in the quality of atrial fibrillation care in Alberta, Canada.
Methods: In a population-based cohort of adults (age ≥ 18 yr) with incident nonvalvular atrial fibrillation (NVAF) diagnosed between Apr. 1, 2008, and Mar. 31, 2016, in Alberta, we investigated the variation in national quality indicators of atrial fibrillation care developed by the Canadian Cardiovascular Society. Specifically, we assessed the geographic and temporal variation in the proportion of patients with initiation of oral anticoagulant therapy, persistence with therapy, ischemic stroke and major bleeding outcomes 1 year after atrial fibrillation diagnosis using linked administrative data sets. We defined stroke risk using the CHADS2 score. We assessed geographic variation using small-area variation statistics and geospatial data analysis.
Results: Of the 64 093 patients in the study cohort (35 019 men [54.6%] and 29 074 women [45.4%] with a mean age of 69 [standard deviation 15.9] yr), 36 199 were at high risk for stroke and 14 411 were at moderate risk. Within 1 year of NVAF diagnosis, 20 180 patients (55.7%) in the high-risk group and 6448 patients (44.7%) in the moderate-risk group were prescribed anticoagulation. A total of 2187 patients (3.4%) had an ischemic stroke, and 2996 patients (4.7%) experienced a major bleed. There was substantial regional variation observed in initiation of oral anticoagulant therapy but not in the proportion of patients with ischemic stroke or major bleeding. Among the 64 Health Status Areas in Alberta, therapy initiation rates ranged from 22.6% to 71.2% among patients at high stroke risk and from 22.7% to 55.8% among those at moderate stroke risk, with clustering of lower therapy initiation rates in rural northern regions.
Interpretation: The rate of initiation of oral anticoagulant therapy among adults with incident atrial fibrillation was less than 60% in patients in whom oral anticoagulant therapy would be considered guideline-appropriate care. The large geographic variation in oral anticoagulant prescribing warrants additional study into patient, provider and health care system factors that contribute to variation and drive disparities in high-quality, equitable atrial fibrillation care.
Atrial fibrillation is the most common sustained cardiac rhythm disorder and is a critical public health issue.1 An estimated 33.5 million people worldwide and more than 350 000 Canadians live with atrial fibrillation. 1,2 In the context of an aging population and increasing concomitant cardiovascular risk factors, the prevalence is rising rapidly and is expected to triple over the next 3 decades.2–4
The clinical and economic consequences of atrial fibrillation are substantial. The disorder is associated with a fivefold increased risk of ischemic stroke and twofold risk of death.5 The estimated annual health care costs associated with atrial fibrillation in Canada are more than $800 million from hospital admissions alone, after accounting for inflation.6
High-quality evidence guides atrial fibrillation management, including use of oral anticoagulants to reduce the risk of ischemic stroke.7 Yet, despite multiple guideline documents disseminated by major cardiovascular societies,8–10 the uptake of evidence-based atrial fibrillation therapies into routine clinical practice is less than optimal. For example, among people with atrial fibrillation at high risk for stroke, the rate of initiation of oral anticoagulant treatment is less than 60% despite strong guideline recommendations based on high-quality evidence.11,12 The consequences of inappropriate care are substantial and include higher rates of stroke, disability and death.5
Prior studies have focused on patient-level factors influencing oral anticoagulant use.13–15 However, potential contributors to variation in oral anticoagulant prescribing are multifactorial and include physician-level characteristics and characteristics at the level of the regional health care system. 16,17 These factors may include availability of laboratory monitoring for warfarin, access to primary care and specialty consultation, and regional socioeconomic barriers that may limit the uptake of direct oral anticoagulants. Analyses of small-area practice variation have shown unwarranted variation, or medical practice variation across regions or provider groups that is not explained by illness, patient risk factors or patient preferences.18,19 Thus, analyses of variation in care may help facilitate targeted interventions to change practice, promote adherence to guideline-based care, identify health care disparities and improve patient outcomes.
The objective of this study was to assess for potential geographic variation in the quality of atrial fibrillation care in Alberta, Canada, with the use of national quality indicators defined by the Canadian Cardiovascular Society.
Methods
Setting and study design
We conducted a population-based cohort study of adults with incident atrial fibrillation between Apr. 1, 2008, and Mar. 31, 2016, in Alberta, a province of 4.2 million people at the end of 201620 served by a single health care system. All Alberta residents except for members of the military, federal inmates, people who opt out of the Alberta Health Care Insurance Plan and members of the Royal Canadian Mounted Police21 are eligible for public health insurance.
Data sources
We used deidentified data from the Interdisciplinary Chronic Disease Collaboration Data Repository, which includes provincial laboratory and linked patient-level administrative health data (including demographic characteristics, vital statistics, physician claims, dispensed prescription medications, hospital admissions, and emergency department and ambulatory visits) of Albertans eligible for public health insurance. More than 99% of Alberta residents participate in the government-sponsored insurance plan.22 Each resident is assigned a personal health number, which acts as a unique lifetime identifier that enables linkage of administrative health data maintained by Alberta Health.23
We used the Pampalon deprivation index (Appendix 1, available at www.cmajopen.ca/content/10/3/E702/suppl/DC1) as a comprehensive indicator of socioeconomic status. We obtained deprivation scores from the Institut national de santé publique du Québec and assigned them to people in the Alberta cohort based on postal code.24
Study cohort
The study cohort included all adults (age ≥ 18 yr) with incident nonvalvular atrial fibrillation (NVAF) in Alberta between Apr. 1, 2008, and Mar. 31, 2016. Patients with an atrial fibrillation diagnosis were identified if they had 1 hospital admission for atrial fibrillation or 2 physician claims for atrial fibrillation at least 30 days apart, as determined with previously validated algorithms using administrative codes (sensitivity 84%, specificity 98%25–27) (Appendix 1, Table S1).
Exclusion criteria included prior atrial fibrillation diagnosis (defined as any atrial fibrillation claim within a 2-year window before index atrial fibrillation date) or valvular heart disease.12 To be consistent with the quality indicators for atrial fibrillation developed and updated by the Canadian Cardiovascular Society28,29 (Appendix 1, Table S2), we did not exclude patients at high bleeding risk from the study.
Outcomes
Study outcomes were based on the quality indicators for atrial fibrillation care developed by the Canadian Cardiovascular Society.28,29 The primary outcome was the proportion of patients with NVAF at high stroke risk who filled any oral anticoagulant prescription (i.e., initiation of oral anticoagulant therapy), with either vitamin K antagonist or direct oral anticoagulant, within 1 year of NVAF diagnosis. Secondary outcomes included the proportion of any filled oral anticoagulant prescriptions (i.e., initiation of oral anticoagulant therapy) within 1 year among patients with incident NVAF at moderate risk for stroke, the proportion of patients with ischemic stroke within 1 year of NVAF diagnosis, and the proportion of patients with major hemorrhage within 1 year of NVAF diagnosis. Consistent with national quality indicators and for the purposes of this analysis, we defined stroke risk using the CHADS2 score,30 where patients at high risk were those aged 75 years or more or with a CHADS2 score of 2 or higher,28 and patients at moderate risk were those aged 65–74 years with a CHADS2 score of 0 or 1.8
We also determined the proportion of patients who persisted with oral anticoagulant treatment at 1 year. We defined persistence as a minimum of 6 months of ongoing prescription fills of any oral anticoagulant (including warfarin and direct oral anticoagulants [dabigatran, rivaroxaban, apixaban and edoxaban]). As the introduction of direct oral anticoagulants may have influenced rates of initiation of and persistence with oral anticoagulant therapy, we also assessed in a post hoc analysis the regional patterns of filled prescriptions for direct oral anticoagulants among patients who initiated oral anticoagulant treatment. We ascertained initiation of and persistence with oral anticoagulant treatment among patients who were alive beyond 90 days after NVAF diagnosis.
The administrative codes used to identify study outcomes and baseline comorbidities for calculation of the CHADS2 score are listed in Appendix 1, Table S2.
Geographic regions
We reported the primary and secondary outcomes by geographic region using household postal codes. People included in the study cohort were assigned to 1 of the 64 Health Status Areas (HSAs) in Alberta.31 The boundaries for each HSA are based on community likeness, travel patterns and shared public services, with a population goal of 25 000–55 000 people.
Statistical analysis
We presented continuous variables as means and standard deviations (SDs), and reported categoric variables as proportions, or medians and interquartile ranges (IQRs). We assessed temporal trends in each outcome using the Mann–Kendall test for monotonic trends.32,33
For the geographic variation analysis, we reported outcomes by geographic area, and calculated age- and sex-adjusted proportions per year by direct standardization, using the entire atrial fibrillation cohort as the reference population. We used the age- and sex-adjusted proportions to estimate geographic variation using small-area variation statistics, including the extremal quotient (EQ), weighted coefficient of variation, χ2 statistic and systematic component of variation (SCV).34–36 The EQ describes the largest relative difference in rates by taking a ratio of the highest and lowest rates of use. The weighted CV is the standard deviation of the rates divided by the mean rate, weighted by the population of each area. The SCV accounts for both random and nonrandom variation, and is considered a more robust method to quantify differences in rates among regions.35,37 The SCV is calculated with the following formula:

where O is the number of observed events in HSA region i, and E is the number of expected events given age- and sex-specific rates for k number of HSAs. Values of SCV between 3 and 5.4, between 5.5 and 10, and greater than 10 are considered to represent moderate, high and very high variation, respectively.38,39 Under the null hypothesis of homogeneity of outcomes across all regions, the SCV would be 0.
To better visualize potential variation across the province, we performed geospatial analysis using the global Moran’s I40,41 and hot-spot analysis using the Getis–Ord Gi* statistic with fixed-distance spatial weights.42,43 Moran’s I is a measurement of spatial autocorrelation, where the null hypothesis is that the distribution of outcomes per HSA follows a random pattern across the province without clustering of outcomes.44 We used hot-spot analysis to detect spatial patterns of clustered high or low rates in the study outcomes.
To examine the association between regional patterns in the proportion of direct oral anticoagulant prescriptions, and in initiation of and persistence with oral anticoagulant therapy, we conducted a panel data analysis to control for all unobserved and time-invariant individual heterogeneity within HSAs. Since regional differences across HSAs may influence stroke or major bleeding outcomes, we chose a generalized least squares random effects model a priori with the random effect as the HSA; we tested this assumption using a Hausman test for model misspecification.45
Statistical significance was set at a 2-sided p value < 0.05. We performed all statistical analyses using Stata IC 15.1 (StataCorp). We used ArcGIS 10.7.1 (Esri) to perform geospatial analyses.
Ethics approval
Ethics approval was obtained from the University of Calgary Conjoint Health Research Ethics Board. Informed consent was waived owing to the use of deidentified data.
Results
The study cohort included 64 093 adults (35 019 men [54.6%] and 29 074 women [45.4%] with a mean age of 69 [SD 15.9] yr) with an incident diagnosis of NVAF between Apr. 1, 2008, and Mar. 31, 2016 (Appendix 1, Figure S1). The baseline characteristics of the cohort are presented in Table 1. The median CHADS2 score was 2 (IQR 1–3). Hypertension (40 849 patients [63.7%]), age 75 years or more (26 390 [41.2%] and diabetes (14 718 [23.0%]) were the most prevalent risk factors.
Baseline characteristics of patients with nonvalvular atrial fibrillation by stroke risk and oral anticoagulant use
A total of 3035 patients (4.7%) were excluded before ascertainment of initiation of or persistence with oral anticoagulant therapy as they died within 90 days of NVAF diagnosis. Of the 64 093 included patients who survived beyond the 90-day exclusion period, 6565 (10.2%) died within 1 year, and 394 (0.6%) emigrated out of the province and were lost to follow-up.
Oral anticoagulant prescribing and temporal trends
Of the 64 093 patients in the study cohort, 36 199 were at high risk for stroke and 14 411 were at moderate risk. Within 1 year of NVAF diagnosis, 20 180 patients (55.7%) in the high-risk group and 6448 patients (44.7%) in the moderate-risk group were prescribed anticoagulation. The median duration of continuous oral anticoagulant treatment in the 12 months after therapy initiation was 8.8 (IQR 4.8–10.6) months in the high-risk group and 8.4 (IQR 3.4–10.3) months in the moderate-risk group.
Between 2008/09 and 2015/16, the annual unadjusted proportions of patients in whom oral anticoagulant therapy was initiated ranged from 51.3% to 65.5% among patients at high stroke risk, and 39.2% to 51.6% among those at moderate stroke risk (Table 2; Appendix 1, Figure S2). Over the study period, 12 486 patients (61.9%) at high stroke risk and 3546 (55.0%) at moderate stroke risk met the criteria for persistence with treatment.
Crude outcomes at 1 year
Among patients at high risk for stroke, there was an increase in the rate of initiation of anticoagulation therapy over the study period (Mann–Kendall p = 0.02). However, persistence with therapy remained stable (Mann–Kendall p = 0.1). There was no change in either outcome in the moderate-risk cohort (Mann–Kendall p = 0.4 and p = 0.9, respectively).
Geographic variation in oral anticoagulant prescribing
An interactive map depicting the geographic variation in atrial fibrillation quality indicators and socioeconomic characteristics by HSA is available online (https://bit.ly/3fOXJq3).
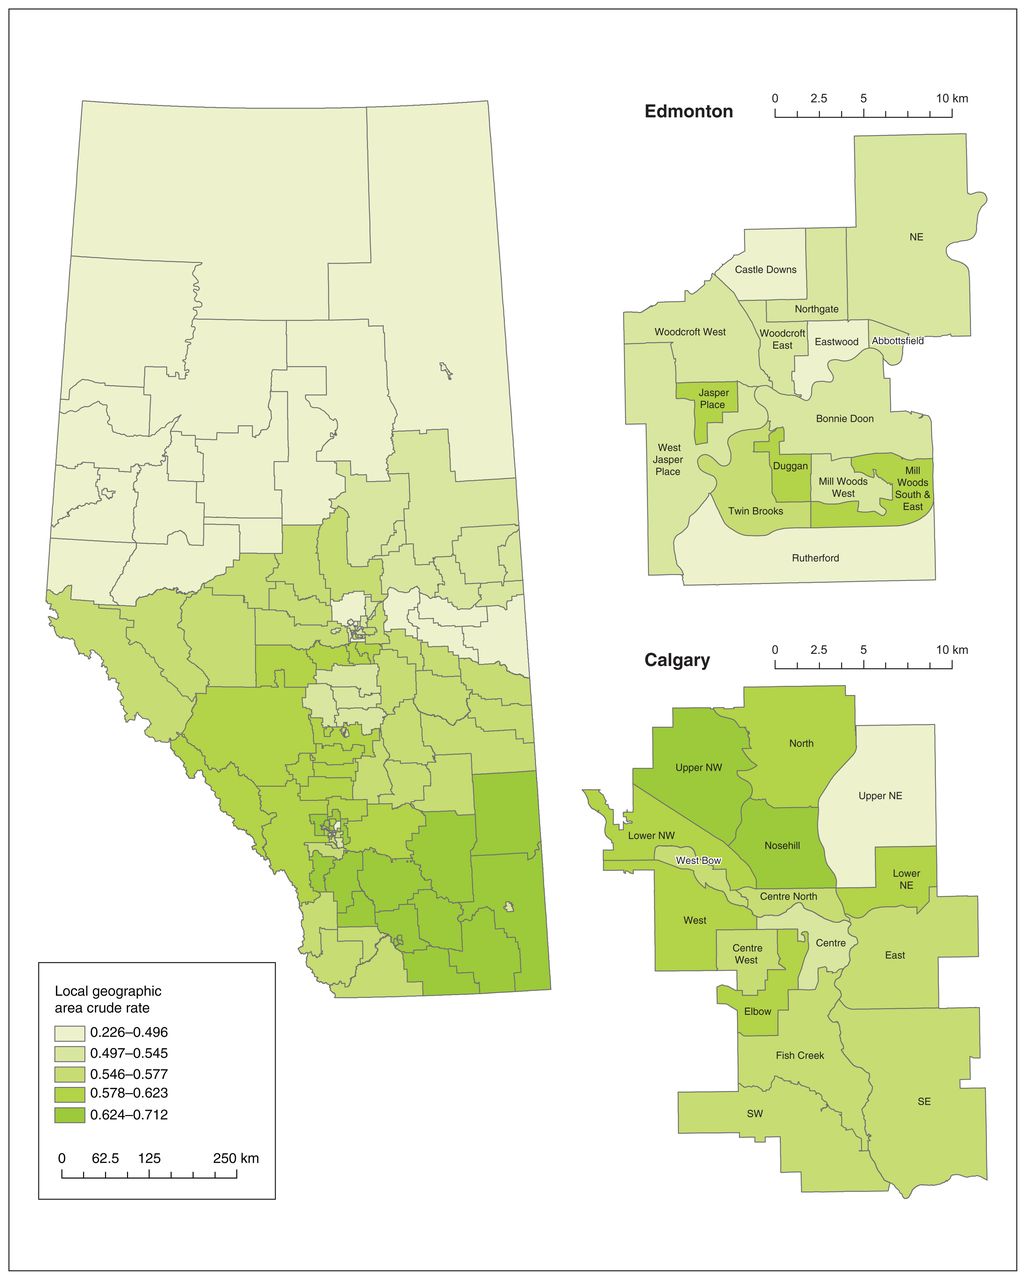
The crude rates of initiation of oral anticoagulant therapy among patients at high stroke risk and those at moderate stroke risk by HSA over the 8-year study period are shown in Figure 1 and Figure 2, respectively. Therapy initiation rates ranged from 22.6% (95% confidence interval [CI] 14.6%–30.5%) to 71.2% (95% CI 60.0%–82.3%) among patients at high stroke risk, and from 22.7% (95% CI 13.2%–32.2%) to 55.8% (95% CI 47.2%–64.3%) among those at moderate stroke risk. Rates of persistence with therapy ranged from 9.7% (95% CI 6.3%–13.1%) to 48.1% (95% CI 40.5%–55.6%) among patients at high stroke risk and from 12.7% (95% CI 10.9%–14.5%) to 33.6% (95% CI 27.6%–39.7%) among patients at moderate stroke risk (Appendix 1, Figures S3 and S4).

Crude rates of initiation of oral anticoagulant therapy among patients with nonvalvular atrial fibrillation at high risk for stroke by Health Status Area, April 2008 to March 2016. Online map available at https://bit.ly/3fOXJq3.

Crude rates of initiation of oral anticoagulant therapy among patients with nonvalvular atrial fibrillation at moderate risk for stroke by Health Status Area, April 2008 to March 2016. Online map available at https://bit.ly/3fOXJq3.
Large variation was observed in initiation of therapy across HSAs in each study year (Table 3; Appendix 1, Figure S5). Among patients at high stroke risk, the median EQ over the study period was 5.5, indicating at least a fivefold difference between the regions with the highest and lowest rates of therapy initiation. For the moderate-risk group, the median EQ was 7.6. The corresponding median SCV values were 20.3 and 28.7. Practice variation (as quantified by the SCV) in initiation of therapy in patients at high stroke risk appeared to decrease over the study period (Mann–Kendall p = 0.04). There was also substantial variation in persistence with therapy across the province, in both the high-risk and moderaterisk cohorts.
Small-area variation analysis*
To further assess variation, we conducted geospatial analysis of regional rates of initiation of oral anticoagulant therapy. There was spatial heterogeneity in the adjusted rates for both the high-risk group and the moderate-risk group across the 64 HSAs (global Moran’s I p < 0.001 and p = 0.005, respectively). In the hot-spot analysis, relatively lower therapy initiation rates tended to be clustered among HSAs in northern rural Alberta as opposed to the HSAs comprising urban centres and HSAs located in southern Alberta.
The proportion of direct oral anticoagulant prescriptions among patients at high stroke risk (Appendix 1, Figure S6) and moderate stroke risk (Appendix 1, Figure S7) ranged from 12% to 38% and from 19% to 49%, respectively. In the panel data analysis limited to the study years in which direct oral anticoagulants were on the provincial formulary (2010/11 to 2015/16), there was a significant association between the proportion of direct oral anticoagulant prescriptions and initiation of oral anticoagulant therapy (p < 0.001) and persistence with oral anticoagulant therapy (p < 0.001) in the high-risk cohort. In the moderate-risk cohort, direct oral anticoagulant initiation and oral anticoagulant prescription did not appear to be associated.
Ischemic stroke and major bleeding
During the study period, 2187 patients (3.4%) had an ischemic stroke and 2996 patients (4.7%) experienced a major bleed within 1 year of NVAF diagnosis. Over the 8-year study period, the proportion of patients who experienced a stroke varied between 3.1% and 4.4%, and the proportion with a major bleed varied between 4.2% and 5.1% (Table 2; Appendix 1, Figure S2). There was a reduction in the incidence of ischemic stroke over the study period (Mann–Kendall p = 0.01) but not in the incidence of major bleeding (Mann–Kendall p = 0.3).
The proportion of patients with ischemic stroke at 1 year varied among HSAs, from 1.5% (95% CI 1.1%–1.9%) to 4.9% (95% CI 4.3%–5.4%) (Appendix 1, Figure S8). For major bleeding, the regional proportions ranged from 1.9% (95% CI 1.8%–2.1%) to 7.0% (95% CI 6.4%–7.6%) (Appendix 1, Figure S9). Across all HSAs, there was no significant regional variation in either ischemic stroke or major bleeding, as indicated by SCV values less than 1 and nonsignificant χ2 tests (Table 3). However, the EQ and weighted coefficient of variation for these outcomes were considered less reliable, as they are susceptible to outlier values with outcomes that occur infrequently.37
Interpretation
In this population-based study of more than 64 000 adults with newly diagnosed atrial fibrillation in Alberta, we found that less than 60% of eligible patients filled an oral anticoagulant prescription within 1 year of atrial fibrillation diagnosis. Rates of initiation of oral anticoagulant therapy increased significantly over the 8-year study period among patients at high stroke risk but not among those at moderate stroke risk. We noted substantial practice variation (as quantified by the SCV) in therapy initiation across the 64 HSAs, with lower initiation rates clustered in northern, rural regions, where a larger proportion of the population identify as Indigenous peoples than in other regions of the province.46 Interestingly, we did not observe significant variation in the age- and sex-adjusted risks of ischemic stroke or major bleeding.
Our study provides a contemporary assessment of geographic variability in the quality of atrial fibrillation care in Canada. Previous work was conducted more than 2 decades ago by the Canadian Cardiovascular Outcomes Research Team, who described regional variation in rates of hospital admission for atrial fibrillation between 1997 and 2000.47 The current study builds on this prior work and reports regional variation in the national patient-relevant quality indicators for atrial fibrillation care, including oral anticoagulant prescribing and incidence of ischemic stroke and major bleeding among patients with a new diagnosis of atrial fibrillation in outpatient or inpatient settings in Alberta.28 The large geographic variation in oral anticoagulant prescribing among patients with atrial fibrillation at high stroke risk implies the need for further study into the reasons for variation to ensure the population is receiving high-quality and equitable atrial fibrillation care.
Our findings are consistent with those of prior studies on practice variation in atrial fibrillation care from the United States, Europe and Japan.48–50 In a study of Medicare beneficiaries with newly diagnosed atrial fibrillation in the US, there was high practice variation in initiation of oral anticoagulant therapy (coefficient of variation = 14.16), with the probability of therapy initiation ranging from 32.4% to 71.9% among hospital referral regions.49 Similarly, Christesen and colleagues48 reported substantial variation in rates of initiation of oral anticoagulant therapy across administrative regions in Denmark. Among patients with newly diagnosed atrial fibrillation at high risk for stroke (defined as a CHADS2-VASc score ≥ 251), rates of oral anticoagulant initiation varied from 49.5% to 62.4%. Importantly, higher regional rates of therapy initiation were significantly associated with higher rates of persistence with therapy beyond 1 year, and with lower rates of ischemic stroke and major bleeding. Finally, Inoue and colleagues50 found variation in warfarin use across geographic regions across Japan and that region was an independent risk for thromboembolism in multivariable analysis.
Geographic variation in health care delivery is increasingly recognized as an important aspect of appraising high-value, high-quality care.17,52 Although some practice variation is expected, as it reflects a patient-centred approach to care (i.e., “good variation”),53 the overall low absolute rates of initiation of oral anticoagulant therapy among patients at high stroke risk in the present study suggest a gap in atrial fibrillation care, and that some of the observed practice variation in therapy initiation rates may be due to inadequate implementation of clinical guidelines.
Reasons for unwarranted variation are multifactorial and may reflect the interplay among geographic, provider and patient factors.54–56 At the provider level, regional quality of atrial fibrillation care may reflect the limits of professional knowledge and failures in its application,57,58 such as overestimating bleeding risk despite the wide availability of risk–benefit scores to guide oral anticoagulant prescribing.59 In addition, geographic distribution of specialty care may contribute to the practice variation that we observed. For example, access to laboratory services for International Normalized Ratio monitoring may have contributed to the lower rates of initiation of oral anticoagulant therapy in northern Alberta.
Although the availability of direct oral anticoagulants would be expected to obviate inequities in access to International Normalized Ratio monitoring, administrative and coverage barriers may have limited uptake of oral anticoagulant prescribing. 60 Notably, we found that HSAs with increased use of direct oral anticoagulants were associated with higher rates of both initiation of therapy and persistence with therapy among patients at high risk for stroke. However, we did not observe this relation among patients at moderate stroke risk, which suggests that additional factors are involved in the observed geographic variation in oral anticoagulant prescribing.
The observation that lower rates of initiation of oral anticoagulant therapy were clustered in northern Alberta point to the need to understand the intersectional factors that influence atrial fibrillation care, such as racial or ethnic disparities, and access to both primary and specialty care. Although patients across Alberta who received and did not receive oral anticoagulants appeared to have similar socioeconomic status, regional socioeconomic disparities may also have contributed to the observed variation.
Limitations
Our study did not identify an “optimal” threshold for appropriate initiation of or persistence with oral anticoagulant therapy since we did not have patient-level data regarding the bleeding risk profile, contraindications to anticoagulation, ability to adhere to treatment or information as to who was offered anticoagulation but declined treatment. However, the substantial regional variation in rates of initiation of and persistence with oral anticoagulant therapy suggest a component of unwarranted practice variation and suboptimal atrial fibrillation care.
Evolving clinical practice guidelines may contribute to variation in rates of oral anticoagulant prescribing. In our primary analysis, we reported rates of oral anticoagulant prescribing in patients with atrial fibrillation with a CHADS2 score of 2 or higher, which has historically been considered a population at high risk for stroke regardless of changes in clinical practice guidelines.61,62 We found greater practice variation among patients at moderate stroke risk (i.e., CHADS2 score of 1, or CHADS2 score 0 and age 65–74 yr), which may reflect the introduction and adoption of the CHA2DS2-VASc score and CHADS-65 algorithm in clinical practice guideline updates.63,64 Nevertheless, we based our methodology and outcome definitions on the national recommendations for defining quality indicators in atrial fibrillation.28
That we did not detect geographic variation in ischemic stroke or major bleeding may be partially attributable to the administrative definitions used to identify study outcomes. Consistent with the national quality indicator definitions, we reported 1-year ischemic stroke risk for all patients with incident atrial fibrillation regardless of CHADS2 score. The 1-year assessment of stroke outcome may not be long enough to identify the downstream effects of the observed variation in initiation of oral anticoagulant therapy. Other potential reasons for the discrepancy between process (oral anticoagulant prescribing) and outcome measure may be the small number of clinical events in some of the HSAs, regional differences in coding practices, and unmeasured clinical practice factors such as improved management of atrial fibrillation comorbidities that interact with stroke and bleeding risk. Furthermore, we did not collect data on concomitant use of antiplatelet agents, which may influence stroke and bleeding risk.
We included a cohort of patients with incident atrial fibrillation until Mar. 31, 2016, based on the availability of linked administrative data sets at the time of analysis. Although we were unable to include the most recent years of incident atrial fibrillation, to our knowledge, geographic variation in initiation of oral anticoagulant therapy has not been reported in Alberta previously, and there have been no provincial initiatives to address this need. We do not expect practice variation to have improved substantially in more recent years without policy and health care system interventions.
Conclusion
Between 2008/09 and 2015/16, the rate of initiation of oral anticoagulant therapy within 1 year of new atrial fibrillation diagnosis was less than 60% in patients in whom oral anticoagulant treatment would be considered guideline-appropriate care. There was substantial practice variation in therapy initiation across geographic areas in Alberta, with clustering of lower initiation rates in northern regions. The large geographic variation in oral anticoagulant prescribing warrants additional study into patient, provider and health care system factors that contribute to variation and drive disparities in high-quality, equitable atrial fibrillation care.
Footnotes
Competing interests: Derek Exner reports research grants and personal fees from Abbott, GE Healthcare, Medtronic Canada and HelpWear, outside the submitted work. Stephen Wilton reports research grants from Abbott, Medtronic Canada and Boston Scientific, and consulting feeds from ARCA Biopharma, outside the submitted work. No other competing interests were declared.
This article has been peer reviewed.
Contributors: Derek Chew, Flora Au, Braden Manns and Amity Quinn conceived and designed the study. Brenda Hemmelgarn, Marcello Tonelli and Braden Manns acquired the data. Derek Chew, Flora Au and Amity Quinn analyzed the data. Derek Chew and Amity Quinn drafted the manuscript. All of the authors interpreted the data, revised the manuscript for important intellectual content, approved the final version to be published and agreed to be accountable for all aspects of the work.
Funding: Derek Chew and Amity Quinn are supported by Canadian Institutes of Health Research Banting Postdoctoral Fellowships. Marcello Tonelli is supported by the David Freeze Chair in Health Services Research. Brenda Hemmelgarn is supported by the Roy and Vi Baay Chair in Kidney Research. Braden Manns is supported by the Svare Chair in Health Economics. Derek Exner is supported by a Government of Canada Tier 1 Research Chair in Cardiovascular Clinical Trials. Derek Exner and Stephen Wilton are supported by the Cardiac Arrhythmia Network of Canada.
Data sharing: The data are not publicly available owing to data-sharing agreements but may be available on reasonable request to the corresponding author and with permission of the Interdisciplinary Chronic Disease Collaboration.
Disclaimer: This study is based in part on data provided by Alberta Health and Alberta Health Services. The interpretation and conclusions contained herein are those of the researchers and do not necessarily represent the views of the Government of Alberta or Alberta Health Services. The Government of Alberta, Alberta Health and Alberta Health Services do not express any opinion in relation to this study.
Supplemental information: For reviewer comments and the original submission of this manuscript, please see www.cmajopen.ca/content/10/3/E702/suppl/DC1.
This is an Open Access article distributed in accordance with the terms of the Creative Commons Attribution (CC BY-NC-ND 4.0) licence, which permits use, distribution and reproduction in any medium, provided that the original publication is properly cited, the use is noncommercial (i.e., research or educational use), and no modifications or adaptations are made. See: https://creativecommons.org/licenses/by-nc-nd/4.0/.
References
- © 2022 CMA Impact Inc. or its licensors
In this issue

Article tools


Related Articles
Cited By...
- No citing articles found.