


Abstract
Background: Equitable access to surgical care has clinical and policy implications. We assess the association between social disadvantage and wait times for elective surgical procedures in Ontario.
Methods: We conducted a cross-sectional analysis using administrative data sets of adults receiving nonurgent inguinal hernia repair, cholecystectomy, hip arthroplasty, knee arthroplasty, arthroscopy, benign uterine surgery and cataract surgery from April 2013 to December 2019. We assessed the relation between exceeding target wait times and the highest versus lowest quintile of marginalization dimensions by use of generalized estimating equations logistic regression.
Results: Of the 1 385 673 procedures included, 174 633 (12.6%) exceeded the target wait time. Adjusted analysis for cataract surgery found significantly increased odds of exceeding wait times for residential instability (adjusted odd ratio [OR] 1.16, 95% confidence interval [CI] 1.11–1.21) and recent immigration (adjusted OR 1.12, 95% CI 1.07–1.18). The highest deprivation quintile was associated with 18% (adjusted OR 1.18, 95% CI 1.12–1.24) and 20% (adjusted OR 1.20, 95% CI 1.12–1.28) increased odds of exceeding wait times for knee and hip arthroplasty, respectively. Residence in areas where higher proportions of residents self-identify as being part of a visible minority group was independently associated with reduced odds of exceeding target wait times for hip arthroplasty (adjusted OR 0.82, 95% CI 0.75–0.91), cholecystectomy (adjusted OR 0.68, 95% CI 0.59–0.79) and hernia repair (adjusted OR 0.65, 95% CI 0.56–0.77) with an opposite effect in benign uterine surgery (adjusted OR 1.28, 95% CI 1.17–1.40).
Interpretation: Social disadvantage had a small and inconsistent impact on receiving care within wait time targets. Future research should consider these differences as they relate to resource distribution and the organization of clinical service delivery.
Timely access to surgical care is a global problem. In Canada, poor access is often experienced with long wait times for surgical care.1 Increased surgical wait times negatively affect patient satisfaction, increase health care costs and are associated with poorer health outcomes.1,2
Given that wait times may vary according to patient and community characteristics,3 it is crucial to understand the distribution of wait times across socioeconomic segments. These data shed light on the equity dimension of timely access to surgical care. The Commission on Social Determinants of Health report emphasized the impact of the circumstances in which people are “born, grow, live and work” on health.4 The causal pathway between social determinants and health is complex; however, social disadvantage is strongly associated with reduced access to care and poorer health outcomes.5,6 In health care systems in which out-of-pocket or private health insurance is the norm, direct economic barriers to accessing care are clear. We hypothesized that the negative consequence of social disadvantage related to surgical wait times would be mitigated in publicly funded universal health care systems such as those in Canadian provinces and territories.
There is a gap in understanding the association between social determinants and access to timely surgical care in Canada. Given the ethical, legal and policy importance of equitable access to surgical care, we sought to investigate the association between social disadvantage and wait times for elective surgical procedures in Ontario.
Methods
Ontario is Canada’s most populous province, with a population of 15.1 million residents. Hospital and physician fees for all medically necessary services are paid by the provincial government. Patients can receive surgery at smaller hospitals or large referral centres.7 We conducted an analytical cross-sectional study involving people older than 18 years receiving 1 of 7 scheduled high-volume surgical procedures (knee arthroplasty, hip arthroplasty, knee arthroscopy, benign uterine surgery, cataract surgery, inguinal hernia repair and cholecystectomy) in Ontario from April 2013 to December 2019 for which wait time data were available. The time period was selected to provide a representative period before the onset of the COVID-19 pandemic to reflect a steady state not affected by major disruptions that occurred during the pandemic.
We excluded procedures occurring within 1 year of a previous procedure of the same type, since surgery on potentially bilateral sites, such as arthroplasty, could be intentionally staged, skewing the subsequent procedures’ wait times and undermining the assumption of independence. Of the procedures excluded for occurring within 1 year of the same procedure, cataract surgery constituted the majority, followed by knee arthroplasty, hip arthroplasty, benign uterine surgery and knee arthroscopy. We further excluded urgent procedures and procedures with missing data on wait priority level or the exposures of interest.
The Reporting of Studies Conducted Using Observational Routinely-collected Data guidelines are followed in presenting our analysis.8
Data sources
Surgical procedures were identified in the Wait Times Information System (WTIS) database, which provides standardized wait time tracking for most nonurgent surgeries in Ontario and is administered by Ontario Health, an agency created by the Government of Ontario with a mandate to connect and coordinate the province’s health care system. Individual-level demographic and residence data were obtained from the Registered Persons Database and area-level sociodemographic data from Statistics Canada’s 2016 Census of Population. Comorbidity was classified using Aggregated Diagnosis Groups calculated with the Johns Hopkins ACG System version 10 software, based on subjects’ health care utilization records in the Discharge Abstract Database, Same Day Surgery Database and Ontario Health Insurance Plan (OHIP) physician billing database. These data sets were linked using unique encoded identifiers and analyzed at ICES, a not-for-profit research institute encompassing a community of research, data and clinical experts, whose legal status under Ontario’s health information privacy law allows it to collect and analyze health care and demographic data, without consent, for health system evaluation and improvement (Appendix 1, available at www.cmajopen.ca/content/11/6/E1164/suppl/DC1).
Outcome and exposure
The primary outcome in this analysis was exceeding target wait times for 7 common surgical procedures (knee arthroplasty, hip arthroplasty, knee arthroscopy, benign uterine surgery, cataract surgery, elective inguinal hernia repair and elective cholecystectomy). We chose these procedures a priori because they were the most common elective surgical procedures done in Ontario, are not highly time-sensitive interventions and are generally performed to improve quality of life. Long wait times are common for these procedures, and non-clinical determinants of access are arguably more influential. These 7 surgical procedures constituted 45% of all procedures performed in Ontario between April 2013 and December 2019. Target wait times refer to the time between the decision to treat and the date of surgery, and were predefined based on provincial surgical access targets,9 which did not change over the study period. For the procedures studied, the target wait time for priority level 3 (semi-urgent cases) was 84 days or fewer, and for priority level 4 (elective cases), 182 days or fewer. We excluded procedures that were classified as having a higher degree of urgency (priority level 1 or 2). We generated a binary dependent variable based on these target wait times (within or exceeding the target wait time). Wait time was defined as the time between the clinical decision to proceed with surgical treatment and the surgery date, subtracting any patient-related delays such as undergoing another procedure, change in medical status and patient deferral. Although there are no published data on the validity of WTIS, data from WTIS largely agree with other administrative health data: in our study 97.7% of procedure dates in WTIS matched to a claim in OHIP, and there was a same-surgeon visit claimed in OHIP within 1 day of the “decision to treat” date in WTIS for 82.4% of procedures (range 79.6% [knee arthroplasty] to 87.2% [inguinal hernia repair]) (Appendix 2, available at www.cmajopen.ca/content/11/6/E1164/suppl/DC1).
The exposures of interest were the dimensions (subdomains) of marginalization as measured by the 2016 Ontario Marginalization Index (ON-Marg) for each patient’s neighbourhood of residence. ON-Marg was developed using factor analysis of 42 indicators from the 2016 Census of Population. It is a multidimensional validated composite measure of a group of individuals’ ability to participate in society.10 ON-Marg consists of 4 subdomains: residential instability, material deprivation, dependency and ethnic diversity. Residential instability is a concentration index of family or housing stability and relates to neighbourhood cohesiveness, quality and support. Material deprivation closely relates to poverty and includes income and educational level measures. The dependency index measures the concentration of individuals who do not receive income from employment, including seniors, children, and adults who cannot work or are not compensated. Finally, ethnic diversity and recent immigrants measure the proportion of residents who self-identify as being part of a visible minority group or who have immigrated in the last 5 years.11 ON-Marg is calculated for each dissemination area, a small, stable geographic unit with a typical population of between 400 and 700 individuals, and is a reliable and valid surrogate measure for person-level marginalization.11 Given the multidimensional nature of ON-Marg, it provides a measure of both the structural and intermediate determinants of health disparities.12 To categorize levels of marginalization, all dissemination areas in Ontario were ranked within each domain (or sub-domain) and assigned to a quintile, with quintile 1 representing the dissemination areas with the lowest marginalization and quintile 5 the highest. More than 50% of dissemination areas in the 2016 Census of Population were reported to have 0 recent immigrants, which led to the creation of only 3 categories (i.e., the lower 3 quintiles combined, and the fourth and fifth quintiles).
Statistical analysis
We compared the procedure and patient characteristic distributions for priority level 3 or 4 and for surgery completed within or exceeding target wait times. Covariates included patient age, sex, comorbidity score (the sum of Aggregated Diagnosis Groups), surgical priority level 3 or 4, rural or urban patient residence, geographic region of residence, hospital teaching status, and year of procedure. We performed model-adjusted linear trend tests on the association between area-level determinants and exceeding the waiting target for each surgery type. The association between each covariate and the outcome was estimated using logistic regression models. We modelled age and comorbidity scores as continuous variables using restricted cubic splines. Each covariate was modelled separately to generate unadjusted odds ratios (ORs), except for the main exposures, which were adjusted for region to account for more marginalized dissemination areas being clustered in large cities. To account for the clustering of marginalization measures within dissemination areas, we fit generalized estimating equation (GEE) models clustering surgeries within dissemination areas. Adjusted ORs were estimated using GEE logistic models that included all covariates. We assessed the pair-wise Pearson correlations between model covariates and the variance inflation factors and found no high multicollinearity, with the largest variance inflation factor being 2.3. We conducted analyses where all social determinant variables were modelled individually and in full combination; results were not substantially different and only the latter are reported. The nature of the relation between the main exposures and outcome was qualitatively different across surgery types, and interaction analysis demonstrated significant effect sizes for interactions between surgery type and main exposures; therefore, each of the 7 procedure types was modelled separately.
Ethics approval
This study was approved by the Women’s College Hospital and Sunnybrook Health Sciences Centre research ethics boards.
Results
Figure 1 provides a summary of the study flow and exclusions. Of the 1 385 673 procedures included in the analysis, 174 633 (12.6%) exceeded the target wait time. Table 1 describes procedures exceeding wait time by patient characteristics and priority level. Compared with priority 4, priority 3 procedures were more likely to exceed wait time targets. There was a trend toward increased wait time with an increased age category and year of procedure. Compared with the 7.5% of patients between the ages of 18 and 49 years, 15.8% of patients older than 80 years exceeded the surgical wait time target. Overall, 10.4% of procedures in 2013 exceeded wait time targets, compared with 14.6% in 2017 and 13.8% in 2019. Priority 4 procedures done in non-teaching hospitals were less likely to exceed wait time targets (9.9%) than those done at teaching hospitals (14.3%). Similarly, a higher proportion of priority 4 procedures done in rural areas exceeded wait time targets (14.0%) than in urban areas (10.6%), and patients from Northern (14.7%) and Western (16.9%) Ontario had a higher proportion of procedures exceeding wait times than patients from Toronto (8.8%). Between different procedures, there was significant variability in exceeding wait time targets, from 2.1% for priority 4 cholecystectomy to 40.1% for priority 3 knee arthroplasty. A total of 153 363 (11.1%) procedures had patient-related delays affecting readiness to treat (DARTs). The most common reasons were patient choosing to defer (80.7%), change in medical status (7.0%) and other surgical procedure (6.1%). The procedures most likely to have a patient delay were knee arthroplasty (26.1%) and hip arthroplasty (21.8%), and the least likely were cholecystectomy (6.1%) and uterine (4.1%). Excluding records with DARTs did not substantially change the main findings.

Summary of data management.
Procedures exceeding wait times, by patient characteristics and priority level*
Association of marginalization with prolonged wait times
There was little variation in the unadjusted proportion of patients exceeding wait time targets according to quintiles of dependency (11.0%–13.8%), deprivation (12.1%–12.8%) or instability (11.7%–13.1%) (Table 2). People residing in communities with more individuals who immigrated within the last 5 years had lower rates of exceeding wait times (10.8% v. 13.4%), as did people from communities with more residents identifying as part of a visible minority group (9.6% v. 14.8%), particularly for priority level 4 procedures (7.8% v. 13.4%). Tests of trend were significant (p < 0.05) across the levels of recent immigration for all surgery types except hip arthroplasty and knee arthroscopy, and the proportion of residents who self-identify as being part of a visible minority group for all surgery types except knee arthroplasty and knee arthroscopy.
Procedures exceeding wait times by neighbourhood deprivation* and priority level†
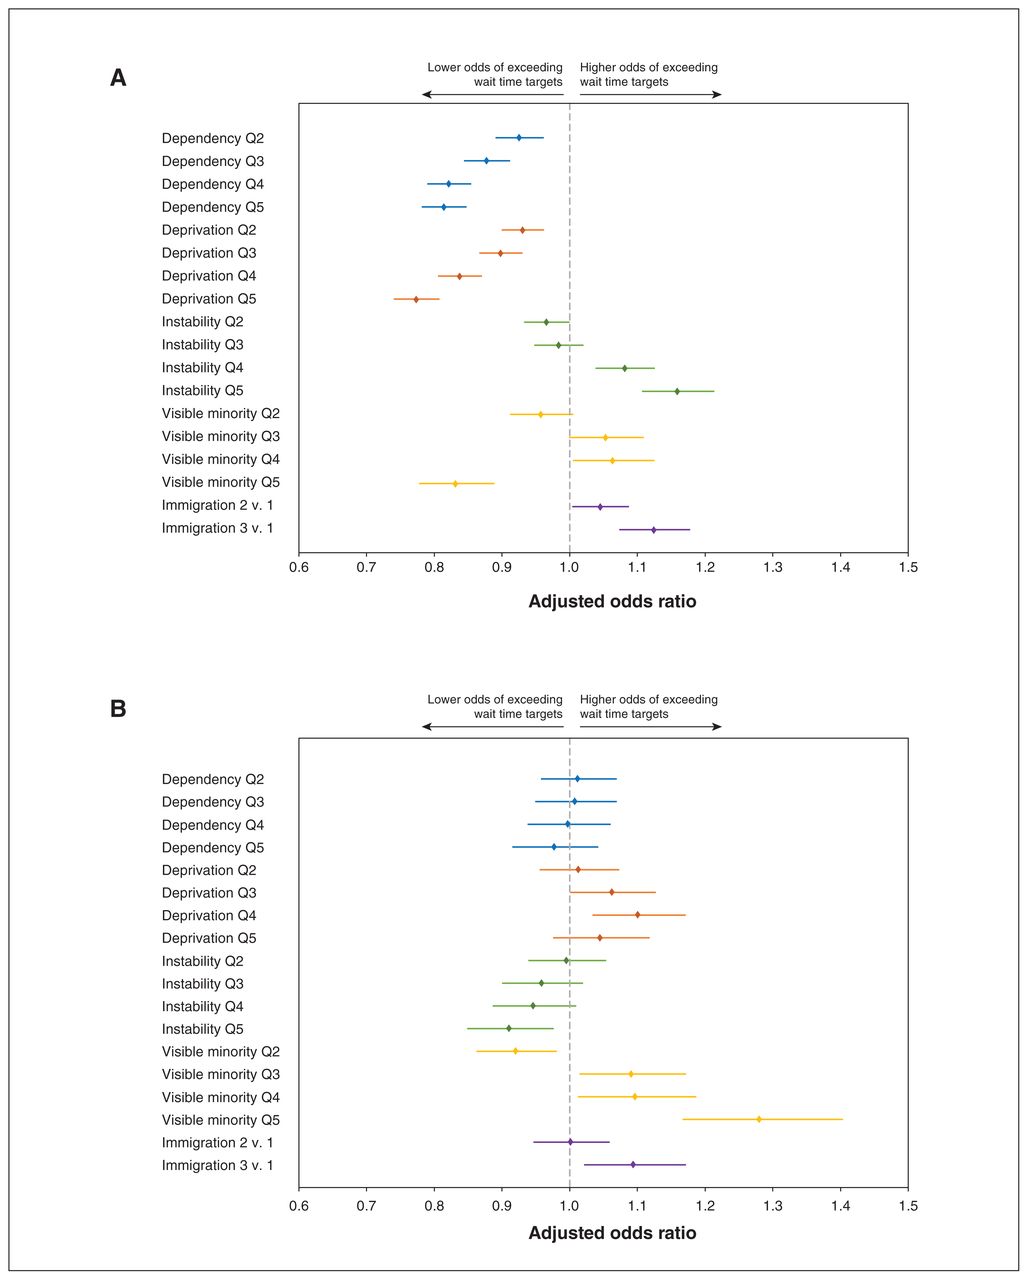
Our analysis of factors associated with prolonged surgical wait times for cataracts and benign uterine surgery is presented in Table 3. For cataract surgery, compared with patients aged 40 years, older age was significantly associated with an increased adjusted odds of exceeding wait times by 10%, 33%, 62% and 83% for patients aged 50 years, 60 years, 70 years and 80 years, respectively. Procedures performed in females, those categorized as priority 3, and those performed in patients from rural areas were also significantly associated with exceeding target wait times for cataract surgery. In contrast, increased comorbidity scores were associated with reduced odds of exceeding waiting times for cataract surgery. There was an increased odds of exceeding target wait times for cataract surgery for 2014–2019 compared with 2013. The adjusted OR peaked in 2017 at 2.55 (95% confidence interval [CI] 2.45–2.66), reducing to an adjusted OR of 2.20 (95% CI 2.11–2.29) in 2019. Compared with residents in Toronto, residents in Ontario’s Western, Eastern and Greater Toronto and Hamilton Area (GTHA) regions had higher adjusted odds of exceeding wait time targets. Compared with quintile 1, adjusted analysis of marginalization domains found significant odds of exceeding wait times for instability quintiles 4 (adjusted OR 1.08, 95% CI 1.04–1.13) and 5 (adjusted OR 1.16, 95% CI 1.11–1.21), and recent immigration quintile 2 (adjusted OR 1.04, 95% CI 1.00–1.09) and 3 (adjusted OR 1.12, 95% CI 1.07–1.18) (Table 3 and Figure 2). Increased dependency and deprivation quintiles had reduced adjusted odds of exceeding cataract surgical wait times. Further, there appeared to be a weak dose response with decreasing odds of exceeding wait times from adjusted OR 0.93 (95% CI 0.90–0.96) to adjusted OR 0.81 (95% CI 0.78–0.85) for dependency and from adjusted OR 0.93 (95% CI 0.90–0.96) to adjusted OR 0.77 (95% CI 0.74–0.81) for deprivation quintile 2 to 5, respectively.
Unadjusted and adjusted risk of prolonged surgical wait times for cataract and benign uterine surgery, according to neighbourhood marginalization measures and patient and hospital factors*†

Forest plots showing the association between odds of exceeding surgical wait time targets by marginalization subdomains for (A) cataract and (B) benign uterine surgery. Note: Q = quintile.
In contrast to cataract surgery, increasing age was associated with lower odds of exceeding the target wait times for benign uterine surgery from adjusted OR 0.90 (95% CI 0.89–0.92) to adjusted OR 0.48 (95% CI 0.43–0.53) for ages 50 years and 80 years compared with age 40 years. Compared with Toronto, residents in other regions of Ontario, particularly Western Ontario (adjusted OR 4.47, 95% CI 4.08–4.90), were all significantly associated with increased odds of exceeding target wait times. There was also a strong association between priority level 4 versus 3 (adjusted OR 4.72, 95% CI 4.55–4.90) and patients receiving care in a teaching hospital (adjusted OR 2.19, 95% CI 2.11–2.28) compared with a non-teaching facility in exceeding target wait times for benign uterine surgery. A smaller but statistically significant association was found between neighbourhood visible minority and recent immigration quintiles and odds of exceeding wait time.
For knee and hip arthroplasty, priority level and deprivation quintile were associated with increased odds of exceeding wait time targets (Table 4). Deprivation quintile 5 was associated with 18% (adjusted OR 1.18, 95% CI 1.12–1.24) and 20% (adjusted OR 1.20, 95% CI 1.12–1.28) increased odds of exceeding wait times for knee and hip arthroplasty, respectively (Figure 3 and Table 4). Older age was associated with increased odds for knee, but decreased odds for exceeding the target wait time for hip arthroplasty. Compared with Toronto, all other regions of Ontario had significantly increased odds of exceeding wait times ranging from adjusted OR 1.87 (95% CI 1.75–2.00) to adjusted OR 1.82 (95% CI 1.68–1.98) in Eastern Ontario and adjusted OR 6.53 (95% CI 6.12–6.97) to adjusted OR 4.71 (95% CI 4.35–5.10) in Western Ontario for knee and hip arthroplasty, respectively. Teaching hospitals were also associated with a significantly increased likelihood (33% and 66% for knee and hip arthroplasty) of exceeding wait time targets. The visible minority quintile was associated with a reducing trend in the adjusted odds of exceeding the target wait time for hip arthroplasty from 5% (adjusted OR 0.95, 95% CI 0.90–1.00) for quintile 2 to 18% (adjusted OR 0.82, 95% CI 0.75–0.91) for quintile 5. Similar to patients receiving knee arthroplasty, patients undergoing knee arthroscopy were more likely to exceed wait times with increased priority (adjusted OR 3.46, 95% CI 3.31–3.62) or having the procedure in a teaching hospital (adjusted OR 1.24, 95% CI 1.18–1.31), or a region outside Toronto (ranging from adjusted OR 1.59, 95% CI 1.46–1.73 for the GTHA to adjusted OR 2.88, 95% CI 2.62–3.16 for Eastern Ontario). Deprivation quintile 2 was associated with a 9% (adjusted OR 1.09, 95% CI 1.02–1.16) increased odds of exceeding arthroscope wait times, increasing to 20% (adjusted OR 1.20, 95% CI 1.11–1.30) for deprivation quintile 5 (Figure 3). Older patients and those from rural areas were less likely to exceed arthroscope wait times.
Unadjusted and adjusted factors associated with prolonged surgical wait times for knee and hip arthroplasty*†

Forest plots showing the association between risk of exceeding surgical wait time targets by marginalization subdomains for (A) knee arthroscopy and (B) knee arthroplasty. Note: Q = quintile.
Unadjusted analysis suggested increased odds of exceeding cholecystectomy wait times for higher dependency, deprivation and instability quintiles (Figure 4 and Table 5). After adjusting for covariates, only the increased deprivation quintile remained significant, with a 16% (adjusted OR 1.16, 95% CI 1.04–1.29) to 32% (adjusted OR 1.32, 95% CI 1.17–1.49) increased odds from quintile 2 to quintile 5. Visible minority quintiles 4 and 5 were associated with reduced odds of exceeding wait times for both cholecystectomy and inguinal hernia repair. Similarly, age 80 years was associated with a 21% reduced odds of exceeding target wait times for both cholecystectomy and inguinal hernia repair, compared with age 40 years. In contrast to arthroplasty and cataract surgery, there was a similar or reduced odds of exceeding wait time between 2014 and 2019 compared with 2013 for both cholecystectomy and inguinal hernia repair. Although rural areas were associated with reduced odds, Western (adjusted OR 1.43, 95% CI 1.24–1.66; adjusted OR 1.39, 95% CI 1.21–1.59) and Northern (adjusted OR 2.26, 95% CI 1.90–2.67; adjusted OR 2.01, 95% CI 1.71–2.35) Ontario had significantly increased odds of exceeding wait times for both cholecystectomy and inguinal hernia repair, respectively. Consistent with analysis for other procedures, cholecystectomy and inguinal hernia repair with increased priority level and conducted in teaching hospitals were at increased odds of exceeding target wait times.

Forest plots showing the association between risk of exceeding surgical wait time targets by marginalization subdomains for (A) cholecystectomy and (B) inguinal hernia repair. Note: Q = quintile.
Unadjusted and adjusted factors associated with prolonged surgical wait time for cholecystectomy and inguinal hernia repair*
The absolute difference in the risk of exceeding wait time targets was small, even for statistically significant comparisons. For example, the absolute difference in risk compared with the largest difference (the contrast of the extreme deprivation quintiles for cataract surgery) was only 3.53% (95% CI 3.21%–3.86%).
Interpretation
Our analysis demonstrated an inconsistent association between social and economic marginalization and exceeding target surgical wait time targets for 7 common elective surgical procedures. Except for cataract and inguinal hernia surgery, increased material deprivation was independently associated with exceeding target wait times. By contrast, residence in areas with increased visible minority populations was independently associated with reduced odds of exceeding target wait times for hip arthroplasty, cholecystectomy and hernia repair surgery but had the opposite effect on benign uterine surgery. Geographic disparities in wait time were consistently found across all 7 procedures, with patients from regions outside Toronto having a significantly higher probability of exceeding target wait times. Differences in resource distribution and access in various geographic regions in Ontario could explain these findings. The sizes of all the effects that were statistically significant were nevertheless small.
In comparison, studies from the United States,14–17 Australia and New Zealand18–20 have generally found non-white race and health-insurance status to be associated with increased surgical wait times. In particular, minority groups had longer wait times for arthroplasty14 and cholecystectomy.20 International studies demonstrate that while dual public–private financed hospital care leads to increased consumer choice, there are deleterious effects on health equity in both low-resource21–23 and high-resource nations.24,25 Hospital care in Canada is financed through a single-payer, publicly financed system. Therefore, access to the surgical procedures considered in this analysis is free at the point of use, eliminating an important barrier to access care for poor, vulnerable or marginalized groups.26 The health care system is an important intermediate social determinant of health outcomes. Our analysis suggests that, once an individual has been diagnosed and assessed as requiring surgery, eliminating the cost barrier to care can ameliorate the downstream effects of structural determinants.
Increased dependency was associated with a slightly reduced probability of exceeding the wait time for cataract surgery. Cataract surgery was the only procedure associated with increased odds of exceeding the target wait time for higher instability quintiles. Where a significant and independent association was found between marginalization subdomains and wait times, our analysis suggests a weak dose response. Effect sizes between marginalization and wait times were consistently small. Our finding that the relation between marginalization and surgical wait time is influenced by surgical procedure and varies by marginalization subdomain is supported by previous studies assessing the association between socioeconomic status and surgical wait times in Canada.13,27–29 Sutherland and colleagues found no relation between individual-level socioeconomic status and surgical wait time for adult general surgery patients in British Columbia, Canada.29 Similarly, after adjusting for covariates, no association was established between socioeconomic status and increased clinic referral or surgical wait times for pediatric surgery in Ontario.27 In contrast, a population-based study using linked administrative data and adjusting for disease severity and patient characteristics found a 6% increase per marginalization quintile in the probability of exceeding surgical wait times for patients with endometrial cancer in Ontario.13
Procedures that were priority level 3 and those done in regions outside Toronto, teaching hospitals, and females were consistently associated with increased odds of exceeding wait time targets. Further, the effect sizes of these associations were much larger than those for marginalization measures. Except for female sex, these observations could be explained by the differences in the organization of services across various geographic regions, the clinical complexity of cases treated in teaching hospitals and the fact that the target wait times for priority 3 patients are much shorter than for priority 4 patients (84 d v. 182 d), making it statistically less likely for procedures categorized as priority 3 to occur within the wait time target. Interestingly, our adjusted analysis suggests that patients residing in rural areas were less likely to exceed wait time targets for all procedures except cataract surgery.
Our study highlights knowledge gaps and areas for future research. It is unclear why social determinants of health and other patient-level factors were associated with poorer access to some procedures but not others. Future research is necessary to understand these relations better and to develop models of care that do not perpetuate inequities in access to care, such as using single-entry models for surgical referrals.
Limitations
Our study should be considered in light of some limitations. We assessed the effects of marginalization only for a defined period in the patient care continuum, from when the clinical decision to proceed with surgical treatment and the time of surgery (the period defined as “Wait 2” in WTIS). Therefore, access to surgical consultation and postoperative follow-up were not analyzed. As a result, it is possible that a biased population — less disadvantaged and better able to navigate the primary care system and access surgical consultation — was included in our analysis.
Our analysis does not address the impact of marginalization on morbidity or mortality.
Individual patients were assigned to marginalization quintiles based on community, not individual characteristics. This could create an ecological fallacy, where population-level factors are ascribed to individual subjects and could potentially have caused our analysis to miss true associations between marginalization and wait times. However, extensive literature shows that neighbourhood-level Ontario marginalization index measures are reliable and valid measures of community-level social disadvantage (and are more representative of person-level characteristics when the unit of analysis is small, such as a dissemination area), and have detected associations between marginalization and health outcomes in other studies.11,13,30,31 Further, there has been increasing awareness about the importance of neighbourhood characteristics and access to health services during the COVID-19 pandemic; even if marginalization measures are more valid for neighbourhoods than for individuals, we can still draw valid conclusions about the effect of residing in an area with greater social disadvantage on access to care.
Our analysis of wait times as a binary rather than a continuous variable might have obscured relations between explanatory variables and access to care. However, whether or not a procedure was done within a predefined wait time target has clear clinical and policy importance, and is currently tracked as a health system performance measure in Ontario.
The analysis was limited to Ontario and may not be generalizable to other jurisdictions in Canada or elsewhere.
Although WTIS appears to correlate well with other administrative health data for Wait 2 times, the reliability and comprehensiveness of the WTIS may have influenced our results. Whereas the “decision to treat” date is subject to a degree of clinical judgment and measurement error, we found that this date could be matched to a surgeon visit in more than 80% of cases. Error in estimating this date (and, consequently, wait times) is likely to be nondifferential with respect to marginalization measures; the effect of any bias would be toward minimizing the association between marginalization measures and wait times, and only to a relatively small magnitude.
Finally, given the large number of comparators, our analysis is at increased risk of type I errors.
Conclusion
We found that marginalization had a limited and inconsistent effect on the odds of receiving care within surgical wait time targets among patients in Ontario. Patients with higher comorbidity burdens and those in rural areas had similar access to timely, non-urgent surgical care. Future research should consider understanding these differences as they relate to the distribution of resources and the organization of clinical service delivery.
Footnotes
Competing interests: None declared.
This article has been peer reviewed.
Contributors: Pieter De Jager contributed to conception, study design, data interpretation, manuscript drafting and manuscript review. Dionne Aleman and Nancy Baxter contributed to data interpretation, study design and manuscript review. Chaim Bell contributed to conception, study design, data interpretation and manuscript review. Merve Bodur contributed to manuscript review and data interpretation. Andrew Calzavara contributed to data analysis, data interpretation and manuscript review. Robert Campbell, Michael Carter, Scott Emerson, Anna Gagliardi and Jonathan Irish contributed to data interpretation, study design and manuscript review. Danielle Martin and Marcy Saxe-Braithwaite contributed to data interpretation and manuscript review. Samantha Lee and Julie Takata contributed to data interpretation, manuscript review and project management. Pardis Seyedi contributed to data analysis and critically reviewed the manuscript. Suting Yang and Claudia Zanchetta contributed to data interpretation and manuscript review. David Urbach contributed to conception, study design, data interpretation, manuscript drafting and manuscript review, and was the principal investigator. All authors gave final approval of the version to be published and agreed to be accountable for all aspects of the work.
Funding: This project was funded by the Canadian Institutes of Health Research through a project grant (no. PJT-166108).
Data sharing: The data set from this study is held securely in coded form at ICES. While legal data-sharing agreements between ICES and data providers (e.g., health care organizations and government) prohibit ICES from making the data set publicly available, access may be granted to those who meet prespecified criteria for confidential access, available at https://www.ices.on.ca/DAS (email: das{at}ices.on.ca). The full data set creation plan and underlying analytic code are available from the authors on request, understanding that the computer programs may rely on coding templates or macros that are unique to ICES and are therefore either inaccessible or may require modification.
Supplemental information: For reviewer comments and the original submission of this manuscript, please see www.cmajopen.ca/content/11/6/E1164/suppl/DC1.
Disclaimer: This study was supported by ICES, which is funded by an annual grant from the Ontario Ministry of Health (MOH) and the Ministry of Long-Term Care (MLTC). This document used data adapted from the MOH Postal CodeOM Conversion File, which contains data copied under license from Canada Post Corporation and Statistics Canada. The Ontario Marginalization Index was provided by the Toronto Community Health Profiles Partnership. Parts of this material are based on data and/or information compiled and provided by the MOH, Canadian Institute for Health Information and Ontario Health. The opinions, results and conclusions reported in this paper are those of the authors and are independent from the funding sources. No endorsement by ICES, Ontario Health, the MOH or MLTC is intended or should be inferred.
This is an Open Access article distributed in accordance with the terms of the Creative Commons Attribution (CC BY-NC-ND 4.0) licence, which permits use, distribution and reproduction in any medium, provided that the original publication is properly cited, the use is noncommercial (i.e., research or educational use), and no modifications or adaptations are made. See: https://creativecommons.org/licenses/by-nc-nd/4.0/
References
- © 2023 CMA Impact Inc. or its licensors
In this issue

Article tools


Related Articles
Cited By...
- No citing articles found.