


Abstract
Background: The COVID-19 pandemic has led to an increased demand for health care resources and, in some cases, shortage of medical equipment and staff. Our objective was to develop and validate a multivariable model to predict risk of hospitalization for patients infected with SARS-CoV-2.
Methods: We used routinely collected health records in a patient cohort to develop and validate our prediction model. This cohort included adult patients (age ≥ 18 yr) from Ontario, Canada, who tested positive for SARS-CoV-2 ribonucleic acid by polymerase chain reaction between Feb. 2 and Oct. 5, 2020, and were followed up through Nov. 5, 2020. Patients living in long-term care facilities were excluded, as they were all assumed to be at high risk of hospitalization for COVID-19. Risk of hospitalization within 30 days of diagnosis of SARS-CoV-2 infection was estimated via gradient-boosting decision trees, and variable importance examined via Shapley values. We built a gradient-boosting model using the Extreme Gradient Boosting (XGBoost) algorithm and compared its performance against 4 empirical rules commonly used for risk stratifications based on age and number of comorbidities.
Results: The cohort included 36 323 patients with 2583 hospitalizations (7.1%). Hospitalized patients had a higher median age (64 yr v. 43 yr), were more likely to be male (56.3% v. 47.3%) and had a higher median number of comorbidities (3, interquartile range [IQR] 2–6 v. 1, IQR 0–3) than nonhospitalized patients. Patients were split into development (n = 29 058, 80.0%) and held-out validation (n = 7265, 20.0%) cohorts. The gradient-boosting model achieved high discrimination (development cohort: area under the receiver operating characteristic curve across the 5 folds of 0.852; validation cohort: 0.8475) and strong calibration (slope = 1.01, intercept = −0.01). The patients who scored at the top 10% captured 47.4% of hospitalizations, and those who scored at the top 30% captured 80.6%.
Interpretation: We developed and validated an accurate risk stratification model using routinely collected health administrative data. We envision that modelling such risk stratification based on routinely collected health data could support management of COVID-19 on a population health level.
As of Nov. 24, 2021, more than 260 million cases of confirmed SARS-CoV-2 infection and at least 5 million deaths from COVID-19 had been reported worldwide.1 The COVID-19 pandemic has led to an increased demand for health care resources and a shortage of medical equipment and staff. Governments and health care organizations around the globe are currently working on containing and slowing down the spread of infections while trying to understand the risk factors associated with severe complications of COVID-19. It remains unclear which and how risk factors contribute to COVID-19 severity. Such understanding is crucial to help mitigate the health care system’s burden by prioritizing testing and resource allocation for those patients at the highest risk. Furthermore, now that vaccines are available,2 the ability to accurately estimate population risk can guide vaccine rollout strategies and return-to-work prioritization.
Diagnostic and prognostic models for COVID-19 have been developed to support medical decision-making.3 Most of these models depend on clinical data obtained on hospital admission (e.g., radiographs and blood tests) and from demographic and medical records (e.g., age and comorbidity history) to make a prediction.4–7 Since these models can be applied only to patients already hospitalized for COVID-19, it is not possible to extend their use for the general population to identify individuals with the highest potential risk of hospitalization or death from COVID-19. Therefore, risk stratification models that depend only on historical medical records are necessary to fill this gap. Such models are particularly effective in countries with single-payer health care systems, such as Canada, the United Kingdom and Australia, since single-payer systems facilitate access to population-wide medical records. Access to extensive medical records is not limited to single-payer countries, as databases of commercial insurance claims data are also available for large portions of the population in countries with private health care systems, such as the United States.
Our objective was to develop and validate a multivariable model to predict risk of hospitalization for patients infected with SARS-CoV-2. We believe that with sufficient adaptation, such a model may have wide applicability for assessing the risk of severe COVID-19 complications in the population using routinely collected data.
Methods
Design and setting
The province of Ontario in Canada is one of many jurisdictions in the world that has linked medical records on its entire population because of its single-payer health care system and robust infrastructure that links all residents through a unique identifier. Analyzing the medical records of Ontario’s population is particularly interesting because of the province’s high diversity. Almost 3 in 10 Ontarians identify as members of visible minorities, with most of these individuals living in large metropolitan areas, such as the city of Toronto.8 Here, we leveraged this extensive and comprehensive source of data from patients who tested positive for SARS-CoV-2 infection in Ontario to develop a machine-learning model to predict the risk of hospitalization for COVID-19.
Our methodology utilizes general medical and demographic attributes commonly collected in claims data in other countries, thus facilitating the model’s repurposing in other jurisdictions. In this context, we define optimal population health management as the set of actions and informed decisions that maximize health promotion and disease prevention while making efficient use of limited resources, and are informed by a broad set of data inputs.
Data sources and study population
We obtained health administrative records from a comprehensive data repository held at ICES, a not-for-profit research institute in Ontario. The records contained in the ICES repository are actively curated and maintained by data scientists and statisticians to ensure their validity and reliability.
To support COVID-19 research, ICES partnered with the Vector Institute for Artificial Intelligence to develop a high-performance infrastructure, the Health Artificial Intelligence Data Analytics Platform (HAIDAP). Briefly, HAIDAP is a secure computing environment that provides access to health data and advanced analytics, which enable a remote collaborative platform supporting multiple researchers and projects across Ontario using ICES data.
For the present research work, ICES created a continually updated data resource within HAIDAP that aggregates deidentified historical health records of individuals in Ontario who tested positive for SARS-CoV-2 infection. The data included in this study are based on all laboratory-confirmed cases of SARS-CoV-2 infection compiled and held at ICES. Specifically, cases are identified through the Ontario Laboratories Information System (OLIS) and linked to other health data containing demographic, health care use and area-level information using unique encoded identifiers. The Ontario Laboratories Information System captures 88% of publicly reported cases of SARS-CoV-2 infection in Ontario.9
Other data sources used in this study are the Canadian Institute for Health Information Discharge Abstract Database for hospitalization records, OLIS10 for all laboratory data (including tests not related to COVID-19), Ontario Health Insurance Plan (OHIP) for claims and health care usage data, Ontario Drug Benefit for drug prescription records and the Registered Persons Database (https://datadictionary.ices.on.ca/Applications/DataDictionary).
Using the data resource within HAIDAP, we identified all patients aged 18 years and older who were enrolled in OHIP (which covers all Ontario residents) and had nasopharyngeal swabs tested for SARS-CoV-2 between Feb. 2, 2020, and Oct. 5, 2020. Patients were followed up through Nov. 5, 2020, to allow a follow-up period of 30 days. We excluded individuals living in long-term care facilities at the time they tested positive, as these individuals are all at high risk for serious outcomes from COVID-19 and should be prioritized for treatment, prevention and testing regardless of the features we included in our models. Therefore, this model applies to the population not living in long-term care.
Individual laboratory data from OLIS are linked to relevant data sets containing health care use, demographic and geographic information using unique encoders held at ICES. The data from OLIS capture most SARS-CoV-2 infections but may miss results from certain private laboratories in the province, which may result in discrepancies between the number of cases in our study and those officially reported.11
Definition of index date and positive SARS-CoV-2 status
Patients were defined as positive for SARS-CoV-2 infection if they had 1 viral ribonucleic acid positive polymerase chain reaction test during the observation period. The index date for all analyses was defined as the date of the first recorded positive test.
Adverse outcome and baseline characteristics
We determined the adverse outcome as hospitalization for COVID-19 (International Classification of Diseases, 10th Revision code U071) at or within 30 days of the index date, since the median time to event from the index date was 1 (interquartile range [IQR] 0–5) day. We included baseline sociodemographic and clinical characteristics such as age, sex and comorbidity history.
Model development
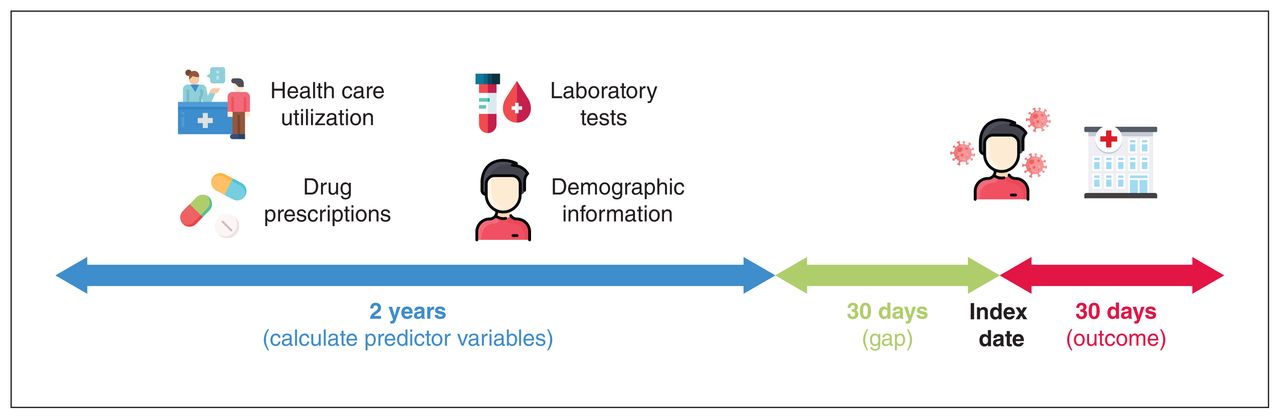
To ensure that only the most recent data before diagnosis of SARS-CoV-2 infection were included in our model, we included medical records dated no later than 30 days before the index date and not earlier than 2 years before the index date (Figure 1). The 2-year window was selected because most (> 92%) patients in our study cohort had at least 2 years of recorded clinical history in our database. Other windows were considered (3, 4 and 5 yr), but we discarded them for not covering more than 90% of the patients. The 30-day buffer before the index date was applied to ensure that only historical medical records were used to make a prediction for each patient and not tests done as a result of the SARS-CoV-2 infection.

Electronic medical records used for model development. The date of diagnosis of SARS-CoV-2 infection is used as the index date. From this date, a look-ahead period of 30 days is used to look for the outcome of hospitalization related to COVID-19. Besides including demographic information, independent predictor variables were constructed by aggregating 2 years of medical records (e.g., past health care utilization, laboratory results and drug prescriptions) up to 30 days before the index date. The complete list of predictor variables calculated can be found in Appendix 1, Supplementary Table 1 (available at www.cmajopen.ca/content/9/4/E1223/suppl/DC1). The icons used in this figure are freely available at www.flaticon.com and were downloaded from this site on Jan. 17, 2021.
In addition to hospitalizations, we aggregated historical records of doctor visits, outpatient services, drug prescriptions and laboratory results for each individual to compute independent predictor variables for model training. Examples of such variables include the number of doctor visits in the last year, the number of corticosteroid prescriptions recorded in the last 2 years, or the number of times that the patient had an abnormal reading of a blood biomarker such as lymphocytes (Appendix 1, Supplementary Table 1, available at www.cmajopen.ca/content/9/4/E1223/suppl/DC1). For each type of laboratory result (blood and urine), we calculated absolute deviations from normal ranges and counted the number of abnormally high or abnormally low measurements recorded in the 2-year window before the index date. As for comorbidities, we included binary variables indicating whether a patient had a history of the following: acute myocardial infarction, arrhythmia, arthritis, asthma, cancer, chronic heart failure, colitis, chronic obstructive pulmonary disease, coronary disease, diabetes, hypertension, osteoarthritis, osteoporosis and kidney disease.
Baseline characteristics of patients included in the study
We excluded variables with records for less than 50% of the patients in our cohort. For example, visits to a nephrologist are recorded only for those patients seeking kidney care; thus, if the variable “number of visits to a nephrologist in the last 2 years” were recorded for less than 50% of the patients, then this variable would be discarded from our model. Compared with previous studies, the 50% threshold is slightly more stringent than the one recently used (33%) by Knight and colleagues.7 The full list of independent predictor variables extracted from the COVID-19 data source, as well as the fraction of patients lacking observations for each variable can be found in Appendix 1, Supplementary Table 1. After filtering variables by number of records across patients, we used backward search for feature selection.12
An 80%/20% random split of the data set (where each example corresponds to 1 patient) was used to define development and validation sets. The validation data set was held back and not used for model training or tuning. For the final model, we built a gradient-boosted trees model using the Extreme Gradient Boosting (XGBoost) algorithm.13 Briefly, gradient-boosted trees is an ensemble model methodology that consists of adding the predictions of several classification and regression trees.14
The set of variables included in our XGBoost model was selected using a backward search approach, and hyperparameter tuning (learning rate, maximum tree depth, number of trees, α and γ) was done with the grid-search algorithm to maximize the cross-validation area under the receiver operating characteristic (ROC) curve. XGBoost allows explicit handling of missing values, and thus we did not perform data imputation in our model. Model discrimination was evaluated by using the area under the ROC curve (C-index), in which a value of 0.5 indicates no predictive ability and 1.0 indicates perfect discrimination. Furthermore, we computed Shapley Additive Explanation (SHAP) values to identify predictive variables that contribute the most to the model output.15 SHAP values represent the weighted average of marginal contributions for each predictive variable included in the XGBoost model.16 That is, the SHAP value of a predictive variable represents how much the variable contributed to the model prediction in a given instance (patient) compared with the average prediction for all instances (patients) in the data set. Finally, to assess the impact of each predictive variable on the predicted outcome, we computed partial dependence plots.17
Statistical analysis
We computed the median and IQR to describe continuous variables across groups in our data set (hospitalized, not hospitalized). To compare variables between the 2 groups, we used the standardized difference18 defined as

for continuous variables, where μ denotes the sample mean of the variable, and σ denotes the sample variance of the variable. The subindices h and n correspond to hospitalized and not hospitalized samples, respectively.
For binary (0 or 1) variables, the standardized difference is defined as
where p denotes the prevalence or mean of the binary variable.
To compare the performance of our model against empirical rules, we computed the recall at the 10th, 20th and 30th percentiles after scoring patients in the validation data set with either our model or the empirical rule. To compare commonly recommended risk factors, we constructed 4 empirical rules and applied them to the held-out validation cohort to see how many actual hospitalizations we could capture. These 4 empirical rules are as follows: rank patients by age and select the oldest patients; rank patients by the number of comorbidities and select patients with the most comorbidities; rank patients by age first, then by number of comorbidities and select patients at the top of the ranking; and rank patients by number of comorbidities first, then by age and select patients at the top of the ranking.
Ethics approval
The use of data in this project was authorized under section 45 of Ontario’s Personal Health Information Protection Act, which does not require review by a research ethics board.
Results
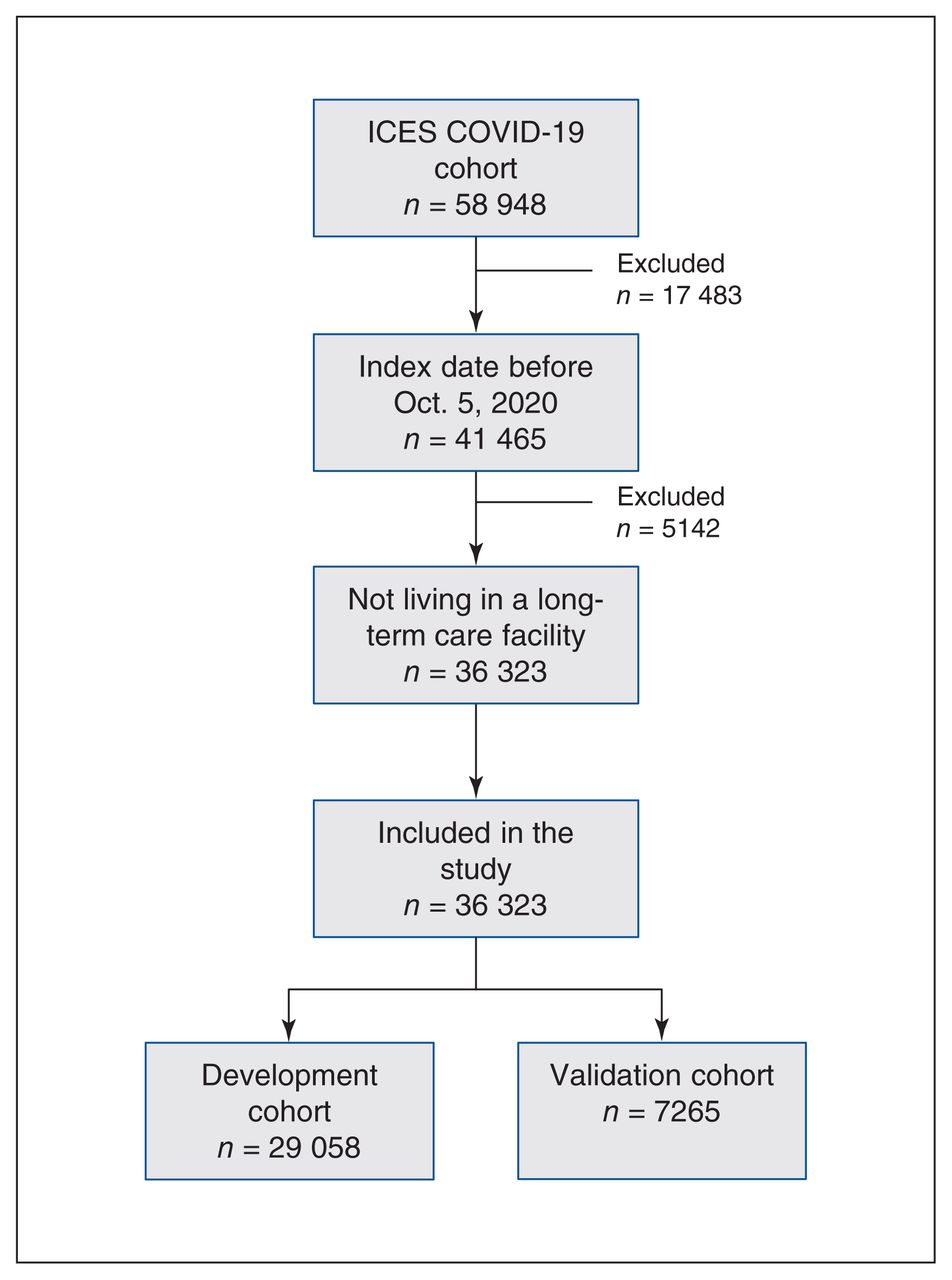
The ICES COVID-19 data source included 58 948 patients who tested positive for SARS-CoV-2 infection between Feb. 2 and Nov. 5, 2020. From these, we excluded patients with an index date after Oct. 5, 2020, as well as patients currently living in a long-term care facility. After exclusions, 36 323 patients were included in our study cohort and followed up for 30 days (Figure 2). We used 80% of the patients for model development (n = 29 058) and 20% for model validation (n = 7265).

Flow diagram of study cohort (derivation and validation). The ICES COVID-19 cohort was last updated on Nov. 7, 2020, and it includes patients with index (diagnosis) dates between Feb. 2, 2020, and Nov. 5, 2020. Patients with an index date after Oct. 5, 2020, or currently living in a long-term care facility were excluded. Included patients were followed up for 30 days for the outcome of hospitalization for COVID-19.
Over the total cohort, the hospitalization rate was 7.1% (2583 hospitalizations) with a median time to event of 1 (IQR 0–5) day, and the mortality rate was 2.5% (906 deaths) with median time to death of 12 (IQR 6–27) days after the index date. The median age of patients in the cohort was 45 (IQR 31–58) years. Table 1 shows the baseline characteristics for all patients in the cohort, and Table 2 shows the same characteristics for the development (29 058; 80%) and validation (7265; 20%) data sets.
Baseline characteristics of patients in the development and validation sets
XGBoost model
From a starting set of 133 variables, we identified 18 important predictor variables of COVID-19 hospitalization and excluded the other 115. The ranking of variables by SHAP scores is shown in Table 3 and Appendix 1, Supplementary Figure 1, and the variables’ marginal impact, visualized via partial dependence plots, is shown in Appendix 1, Supplementary Figure 2. These variables are age, days since the last creatinine blood test, geographical latitude, days since the last basophils blood test, sex, number of family doctor visits in the last year, number of comorbidities, number of different unique subclasses of drugs taken in the last 2 years, highest value of creatinine recorded in the last 2 years, number of diagnostic radiology studies in the last 2 years, average value of neutrophils in blood in the last 2 years, number of doctor visits in the last 2 years, average value of leukocytes in blood in the last 2 years, number of creatinine blood tests in the last 2 years, highest value of hemoglobin recorded in the last 2 years, history of chronic kidney disease, and days since the last mean corpuscular hemoglobin test in the last 2 years.
Variables included in final XGBoost model ranked by SHAP values of importance
The final XGBoost model achieved high discrimination in the fivefold cross-validation setting with the mean area under the ROC curve of 0.852, and the area under the ROC curve of 0.8475 in the held-out validation cohort. Figure 3A shows the ROC curve of the final model. The model also shows excellent calibration, with R2 = 0.998, slope = 1.01 and intercept = −0.01 (Figure 3B; Appendix 1, Supplementary Table 2). Patients in the validation cohort with a score of at least 0.5 (n = 2149, 29.6%) had a hospitalization rate of 20.3%, and patients with a score less than 0.5 (n = 5116, 70.4%) had a hospitalization rate of 2.2%. Furthermore, patients in the validation cohort scored at the top 10% represent 47.4% of actual hospitalizations, and those scored at the top 30% capture 80.6% of hospitalizations (Figure 4).
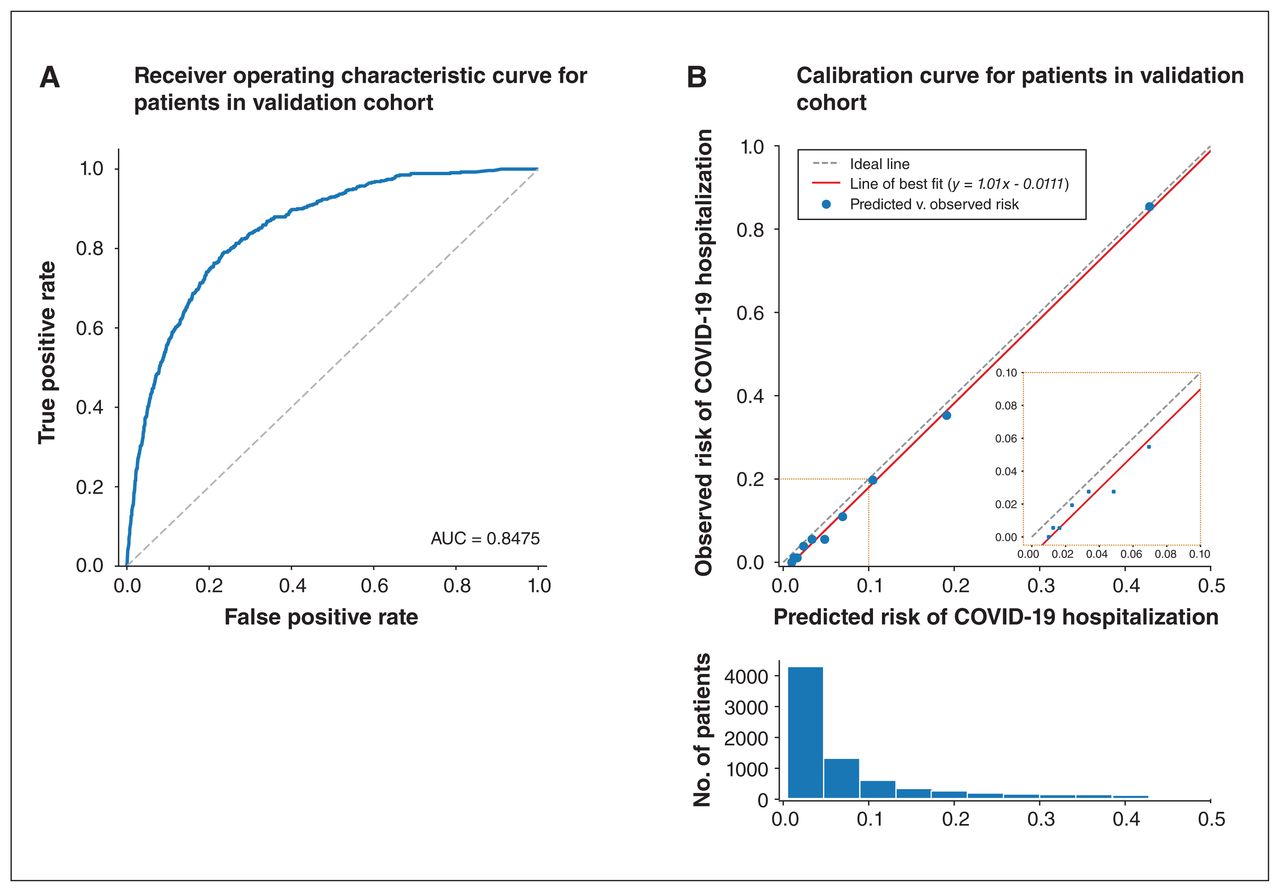
Extreme Gradient Boosting (XGBoost) model performance. The final model was trained with 18 features extracted from the ICES COVID-19 data source. (A) The blue line shows the receiver operating characteristic curve. (B) Calibration curve of the final XGBoost model on the validation data set, where each blue dot (bins in the histogram) corresponds to a decile of predicted risk.

Comparison of recall at top percentiles. The final Extreme Gradient Boosting (XGBoost) model recall (percentage of true hospitalizations recovered in validation data set) was compared against 4 empirical rules.
Geographical latitude and laboratory test history were ranked among the top 10 predictors in our model (Appendix 1, Supplementary Figure 1). Blood biomarkers such as basophils, creatinine and leukocytes were identified as important predictors.
Comparison of XGBoost model recall against 4 empirical rules
We split the held-out validation cohort (n = 7265) into percentiles and calculated the recall at the top 10th (n = 726), 20th (n = 1453) and 30th (n = 2180) percentiles after ranking the cohort according to our model or each empirical rule. The results of this comparison are shown in Figure 4. The final XGBoost model outperformed these rules across the top 3 percentiles with relative gains between 10% and 30%.
Interpretation
We have developed and validated a gradient-boosted trees model for predicting the risk of hospitalization for COVID-19 in a cohort of patients in Ontario. Our model showed excellent calibration and a high discrimination performance consistent across fivefold cross-validation cohorts, which was comparably superior to 4 empirical rules. We envision our model to be deployed and used at the system level where there is access to this type of routinely collected population data, rather than by clinicians directly, to plan resource allocation and other aspects of the public health response, such as targeted testing or vaccination campaigns.
We found that past laboratory test results contributed to model predictions, suggesting that legacy blood tests can be leveraged as a proxy for future risk of hospitalization for COVID-19, despite the fact that these are historical values and not measurements taken at admission.19 We identified past neutrophil counts in blood as a strong contributor to our model predictions. These findings are consistent with recent studies documenting the role of excessive neutrophil counts in severe COVID-19 pneumonia.20,21
After we removed variables with more than 50% missing values (see Methods), there were 115 variables in our data set that were removed from the final XGBoost model after the feature selection process was completed (Appendix 1, Supplementary Table 1). Some of these variables could have influenced hospitalization prediction nonetheless. For instance, marginalization and income quintile indicators are known to correlate with access to health care.22 Additionally, the availability of variables included in our final model is not limited to Ontario’s region, as these are variables readily available in most medical record and insurance claims databases around the world. Thus, our methodology could be extended for scoring populations and informing decision-making in other jurisdictions outside of Ontario, Canada.
Many recently developed prognostic models for COVID-19 rely on information that must be collected after infection or at admission to hospital.23,24 A key strength of our model is that it depends only on historical medical records and demographic variables available before infection. These are variables that are routinely collected and readily available in both public and private medical claims databases used across many countries. One potential application of our model is to aid in vaccination campaigns by, for example, computing risk scores for all patients in Ontario and then ranking patients accordingly to prioritize vaccinations.
Ontario has a diverse population that covers a range of population groups, and thus the model will likely have applicability outside of Ontario or could be easily adapted to score other populations. Although future work with an external data set would be required to validate the model performance in other geographical regions, we have observed that models developed with these data can usually be repurposed to other jurisdictions.25–27 An important strength of our study is the use of gradient-boosted trees, which allow for highly interpretable models to yield novel insights and relations among predictor variables.
After vaccines with sufficient efficacy were announced in October and November of 2020,28 governments of virtually all affected countries started to actively develop vaccine rollout and prioritization schedules.29,30 The most prevalent approach to assessing vaccine risk is to start with the oldest patients (especially those living in long-term care facilities), who account for most reported deaths, and health care workers, who have a high risk of exposure.31 Two factors that commonly influence expert recommendations are age and pre-existing conditions (comorbidities).32 Our model provides an alternative approach to leverage machine learning to predict a risk score for every patient.
Our results indicate that our model can more accurately identify people at high risk of severe complications from COVID-19.
Limitations
Our study has several limitations. First, the variable “geographical latitude” was found to be a strong contributor for predicting risk of hospitalization for COVID-19 in our final model. This suggests that our model learned an association that is specific to the region of Ontario. Nevertheless, geographical features often correlate with sociodemographic factors, such as access to health care and income. Thus, a potential limitation of our model is the need for retraining with updated geographical data before implementing it in a different jurisdiction.
Second, although we had a diverse data source that captured all health care interactions, we lacked access to some data elements that are not collected in routine data holdings. For example, risk factors such as diet and physical activity are associated with disease immunity33 and were not captured in our data. Furthermore, recent studies have identified genetic,34 transcriptomic35 and proteomic36 markers that play an important role in COVID-19 progression and outcome, but these data are not routinely collected at the population level and thus not included in our study. The incorporation of such factors, if available, could boost both accuracy and robustness across subgroups of patients in the population.
A third limitation is that XGBoost models, though somewhat explainable via SHAP values, are not as explicit as the coefficients generated from a logistic regression model. It is thus more difficult to estimate the impact of each predictor variable on the outcome in a way that is familiar to clinical audiences.
Finally, since our model is trained on data from Ontario, we recommend independent validation and possibly retraining if the model is to be used outside of Ontario.
Conclusion
The XGBoost model developed here utilizes 18 health care and demographic variables to predict risk of COVID-19 hospitalization with high performance and excellent calibration. Compared with 4 empirical rules currently used to stratify patients by risk, our model has a higher recall when scoring those patients ranked at the 3 top deciles. Past laboratory test results were found to significantly contribute to model predictions, which suggests that legacy blood tests are important determinants of future COVID-19 hospitalization risk.
Our model has the potential utility to inform public health decision-making directly (e.g., during vaccination campaigns) without relying on empirical measures.37–39 Our model is able to perform risk stratification at a population-wide level, is based on an accurate and explainable algorithm, and demonstrates the potential use of legacy laboratory data as a proxy for potential risk of severe complications from COVID-19. These risk stratification models are currently not in practice in our setting to support health system decision-making for COVID-19. Thus, models like ours can support informed decision-making for optimal population health management.
We envision our model providing a more effective way to use routinely collected data to support strategies that protect patients most at risk for serious complications from COVID-19 and to support more careful and precise management for those at low risk, while making efficient use of the available resources.
Acknowledgements
The authors thank Elisa Candido and Keng-Yuan Liu for providing technical support and giving relevant advice on handling the data. The authors thank IQVIA Solutions Canada Inc. for use of its Drug Information File.
Footnotes
Competing interests: Jahir Gutierrez, Maksims Volkovs and Tomi Poutanen are employed by Layer 6 AI as researchers. No other competing interests were declared.
This article has been peer reviewed.
Contributors: Jahir Gutierrez and Laura Rosella planned the study. Tristan Watson prepared the cohort, and Maksims Volkovs and Laura Rosella contributed to the methodology. Jahir Gutierrez analyzed the data with contributions from Maksims Volkovs and Tomi Poutanen. Maksims Volkovs and Jahir Gutierrez wrote the first draft of the manuscript. Laura Rosella contributed important revisions to the manuscript. All authors contributed to data interpretation and critically reviewed the manuscript. All authors gave final approval of the version to be published and agreed to be accountable for all aspects of the work.
Funding: Layer 6 AI is a machine-learning research group that is part of TD Bank Group. The authors affiliated with Layer 6 AI did not receive any funding or compensation for this work. Laura Rosella is supported by a Tier 2 Canada Research Chair in Population Health Analytics. This study was supported by ICES, which is funded by an annual grant from the Ontario Ministry of Health and Long-Term Care (MOHLTC). This study was supported by the Ontario Health Data Platform (OHDP), a Province of Ontario initiative to support Ontario’s ongoing response to COVID-19 and its related impacts. The study sponsors did not participate in the design and conduct of the study; collection, management, analysis and interpretation of the data; preparation, review or approval of the manuscript; or the decision to submit the manuscript for publication.
Data sharing: The data set for this study is held securely in coded form at ICES. While data sharing agreements prohibit ICES from making the data set publicly available, access may be granted to those who meet prespecified criteria for confidential access, available at https://www.ices.on.ca/DAS. The full data set creation plan is available from the authors on request.
Disclaimer: This study was supported by ICES, which is funded by an annual grant from the Ontario Ministry of Health (MOH) and the Ministry of Long-Term Care (MLTC). Parts of this material are based on data and information compiled and provided by MOH; Canadian Institute for Health Information; Immigration, Refugees and Citizenship Canada; Ontario Laboratories Information System; and IQVIA. The analyses, conclusions, opinions and statements expressed herein are solely those of the authors and do not reflect those of the funding or data sources; no endorsement is intended or should be inferred. This study was supported by the Ontario Health Data Platform (OHDP), a Province of Ontario initiative to support Ontario’s ongoing response to COVID-19 and its related impacts. The opinions, results and conclusions reported in this paper are those of the authors and are independent from the funding sources. No endorsement by the OHDP, its partners, or the Province of Ontario is intended or should be inferred.
Supplemental information: For reviewer comments and the original submission of this manuscript, please see www.cmajopen.ca/content/9/4/E1223/suppl/DC1.
This is an Open Access article distributed in accordance with the terms of the Creative Commons Attribution (CC BY-NC-ND 4.0) licence, which permits use, distribution and reproduction in any medium, provided that the original publication is properly cited, the use is noncommercial (i.e., research or educational use), and no modifications or adaptations are made. See: https://creativecommons.org/licenses/by-nc-nd/4.0/
References
- © 2021 CMA Joule Inc. or its licensors
In this issue

Article tools


Related Articles
Cited By...
- No citing articles found.