


Abstract
Background: Primary malignant brain tumours account for more than one-third of all brain tumours and are associated with high morbidity and mortality. The purpose of this study was to estimate the incidence and prevalence of primary malignant central nervous system (CNS) tumours and trends in these rates in Canada from 1992 to 2017.
Methods: We conducted an epidemiologic study using publicly available data from the Canadian Cancer Registry from 1992 to 2017 (1994 to 2015 for prevalence) for all of Canada except Quebec (1992 to 2011). We calculated the incidence and prevalence per 100 000 person-years and the age-standardized incidence and prevalence per 100 000 person-years of primary malignant CNS tumours and stratified them by sex and age (pediatric [≥ 19 yr], adult [20–64 yr] and older adult [> 64 yr]). Our analyses assessed average disease duration, survival differences between males and females, and trends over time.
Results: During the study period, the average age-standardized incidence and prevalence rates of all primary malignant CNS tumours were 7.9 and 7.6 per 100 000 person-years, respectively. The incidence and prevalence increased by 37.5% and 40.5%, respectively, over the study period. Males accounted for more than half (26 085 [56.4%]) of all diagnoses and experienced decreased survival compared to females 1 year after diagnosis (p = 0.048). Children accounted for 4605 new diagnoses (10.0%), adults for 23 950 (51.7%), and older adults for 17 735 (38.3%). Age-standardized incidence and prevalence rates were highest among older adults.
Interpretation: Overall, the incidence of primary malignant CNS tumours increased from 1992 to 2017, and males and older adults were disproportionately affected. Increased health care resources and awareness are needed to improve identification of these tumours and deliver evidence-based care that balances safety, efficacy and preservation of quality of life for affected patients.
Primary brain tumours account for 2% of all newly diagnosed cancers in Canada and the United States.1 Malignant brain tumours constitute 35.9% of all primary brain tumours, with high-grade gliomas occurring most commonly.2,3 The prognosis for patients with primary malignant brain tumours is poor despite aggressive treatment: the 5-year survival rate is estimated to be 27%.4 Primary malignant brain tumours have a substantial impact on societal and economic costs in Canada, with the expense of investigations, hospital stay and treatment estimated to be $3.2 million annually; 46% of this amount is due to indirect costs from loss of productivity, and 54% is due to direct costs of treatment.5 It is therefore imperative to have a better understanding of the burden of disease in order to assist with improved allocation of health care funding, policy-making, drug manufacturing and advocacy.6
In this study, we used publicly available data from the Canadian Cancer Registry (CCR), to estimate the overall and age-adjusted incidence and prevalence of primary malignant tumours arising from the central nervous system (CNS) in Canada from 1992 to 2017. The purpose of the study was to provide insight into the demographic distribution and trends of the disease, with a specific focus on the distribution of disease by sex and age group in order to identify groups at higher risk.
Methods
Study design
We conducted an epidemiologic study using publicly available data from the CCR to estimate the incidence and prevalence of primary malignant tumours of the CNS in Canada from 1992 to 2017.
Data sources
We obtained data from the CCR database from inception (1992) to July 1, 2017, on the incidence, prevalence and age-standardized incidence of all primary malignant tumours of the brain, cranial and spinal nerves, and other nervous system components.7–9 The data also include population and demography estimates as of July 1, 2017. The Statistics Canada registries were prepared with the use of the Surveillance, Epidemiology, and End Results (SEER) Program Groups for Primary Site based on the International Classification of Diseases for Oncology, Third Edition (ICD-O-3).10
The CCR defines cancer incidence as the number of new cases of primary malignant neoplasms in a population over a 1-year period, updated annually.7 It reported period prevalence over a 2-year duration, with data available from 1994 to 2015.8 The prevalence table was prepared with CCR data linked to the Canadian Vital Statistics – Death Database2 and death information from an income tax returns file, the T1 Personal Master File.8 All prevalence counts from the CCR are tumour-based, referring to the number of tumours diagnosed over a certain period among people who were still alive at the index date (Jan. 1).8 The CCR does not adjust prevalence estimates by residential mobility over time. As a consequence, the province or territory that appears in CCR tables is the one that reported the tumour at the time of diagnosis, not at the end of the prevalence reference period.8 Finally, age groups used in the prevalence tables reflect age at the end of the prevalence reference period, not at the time of diagnosis.8
Tumour diagnoses
All histologic CNS tumour diagnoses ending with the ICD-O fifth digit behaviour code/3 (referring to malignant primary site CNS tumours) were included in the Statistics Canada registries. The ICD-O-3 codes define diagnoses as stated from pathology reports as primary or presumed to be primary. If there is uncertainty regarding the diagnosis, the tumour is classified as unknown; these tumours were not included in the Statistics Canada registries. A complete list of all CNS tumours and their ICD-O codes, along with their fifth digit behaviour codes, can be found in Table 27 of the International Classification of Diseases for Oncology, Third Edition.10 The diagnoses used in this study are presented in Appendix 1 (available at www.cmajopen.ca/content/9/4/E973/suppl/DC1); they include a set list of CNS tumours assumed to be malignant dating back to the beginning of data collection, in 1992.
Data were available from 1992 to 2017 from all provinces and territories except Quebec (1992 to 2011). Raw downloaded data included incidence, prevalence and age-standardized incidence for primary malignant tumours of the brain, cranial and spinal nerves, and other nervous system components, and all primary malignant tumours.
Statistical analysis
We cumulated diagnoses including malignant tumours of the brain, spinal cord, or brain and spinal cord with extension to cranial nerves and other nervous system components. We then grouped these diagnoses by sex and age group: pediatric (≤ 19 yr), adult (20–64 yr for incidence and 20–69 yr for prevalence owing to differences in data reporting) and older adult (≥ 65 yr for incidence and ≥ 70 yr for prevalence).
Age-standardized incidence was available in the raw CCR data. We calculated age-standardized cancer incidence rates using the direct method and the final 2011 Canadian post-censal population structure.9,11 We calculated age-standardized prevalence rates per 100 000 person-years using the 2011 Canadian postcensal population structure and prevalence rates from Statistics Canada. Disease duration was calculated as prevalence divided by incidence.4 We compared the odds of survival 1 year after diagnosis between males and females based on the observed versus expected number of males and females alive at that time. Statistical significance was determined with the χ2 test. We determined the incidence and prevalence of all cancers using CCR data and plotted these data in addition to the data on malignant CNS tumours in order to contrast and compare trends between these 2 groups. All figures and statistical testing were done with R v3.6.2 (R Project for Statistical Computing).
We computed all trend analyses using Joinpoint Trend Analysis software v4.8.0.1 (Joinpoint Regression Program, version 4.8.0.1, Statistical Methodology and Applications Branch, US National Cancer Institute), with trends expressed as annual percent change (APC). For each analysis, the software uses the APC and slope of successive segments to build a model with the optimal number of nodes, or joinpoints. The software begins with 0 joinpoints (a straight line) and sequentially tests whether the slope of the trend in each successive segment is statistically significantly different from the previous segment. If a trend is observed, a new joinpoint is added at that segment, and the mean APC and statistical significance are calculated at the 5% level.
Ethics approval
Ethics approval was not required for this study, as all data used were deidentified and were publicly available on the Statistics Canada website.
Results
Table 1 presents the incidence, prevalence, age-standardized incidence and age-standardized prevalence of primary malignant CNS tumours by age, sex and overall. The overall average age-standardized incidence of primary malignant CNS tumours was 7.9 per 100 000 person-years, and the overall age-standardized prevalence was 7.6 per 100 000 person-years.
Incidence, prevalence, age-standardized incidence and age-standardized prevalence per 100 000 person-years of primary malignant central nervous system tumours, 1992–2017,* by age category and sex
The total number of new cases of primary malignant CNS tumours from 1992 to 2017 (excluding Quebec) was 46 290. Overall, 26 085 cases (56.4%) were in male patients. Children accounted for 4605 new diagnoses (10.0%), adults for 23 950 (51.7%), and older adults for 17 735 (38.3%). The average number of cases per year increased over time, from 1455 in 1992 to 2000 in 2017 (increase of 37.5%). The incidence and age-standardized incidence over time for the 3 age groups and overall are shown in Figure 1, and the log of the age-standardized incidence rate for the 3 age groups and overall is plotted in Figure 2A.
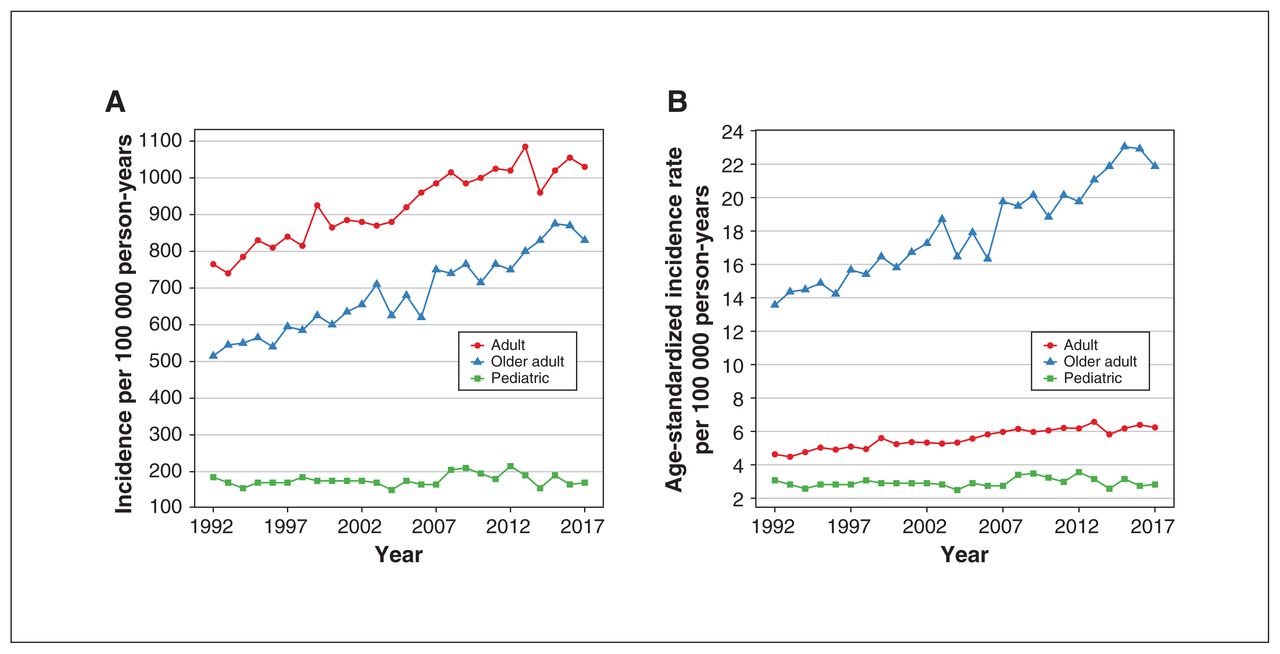
(A) Incidence per 100 000 person-years of primary malignant central nervous system (CNS) tumours in Canada by age category, 1992–2017. (B) Age-standardized incidence per 100 000 person-years of primary malignant CNS tumours by age category, 1992–2017.
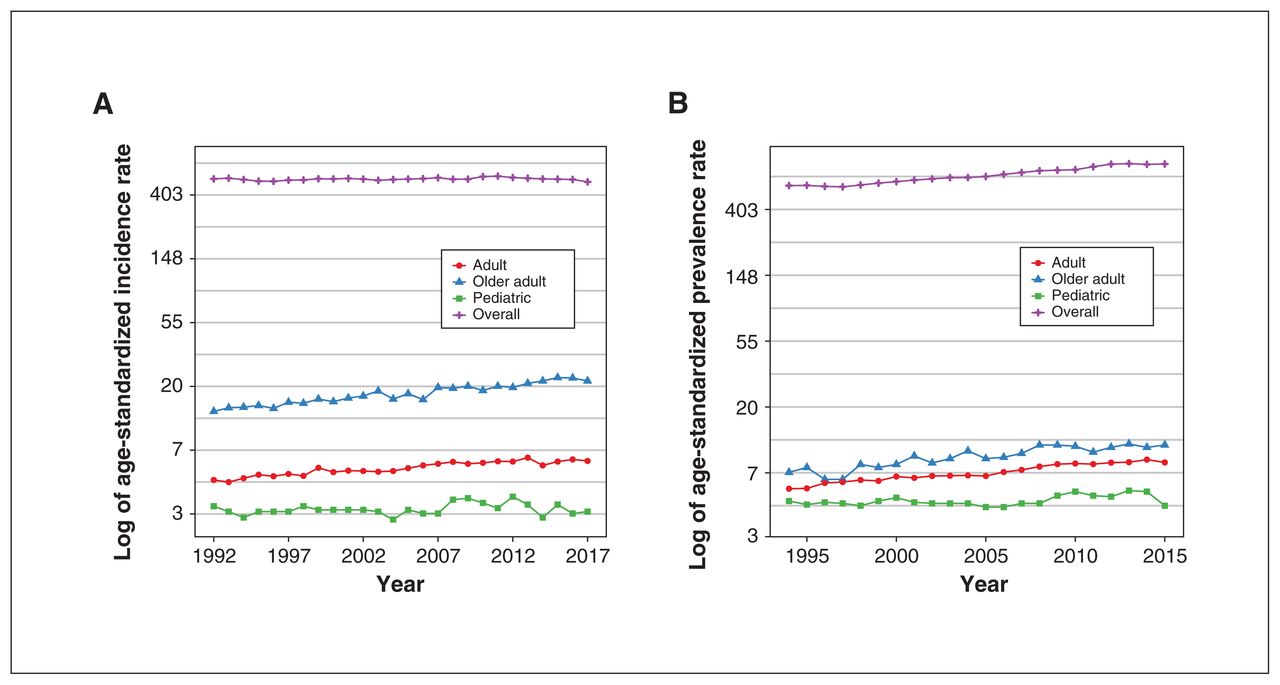
(A) Log of age-standardized incidence rate of primary malignant central nervous system (CNS) tumours for the 3 age categories and overall over time. (B) Log of age-standardized prevalence rate of primary malignant CNS tumours for the 3 age categories and overall over time.
The total prevalence of primary malignant CNS tumours from 1994 to 2015 (excluding Quebec) was 40 750. Overall, 22 860 cases (56.1%) were in male patients. Children accounted for 6430 cases (15.8%), adults for 28 875 (70.9%), and older adults for 5445 (13.4%). The average number of cases per year increased with time, from 1505 in 1994 to 2115 in 2015 (increase of 40.5%). The prevalence and age-standardized prevalence over time for the 3 age groups are presented in Figure 3. The log of age-standardized prevalence rate for the 3 age groups and overall is plotted in Figure 2B.
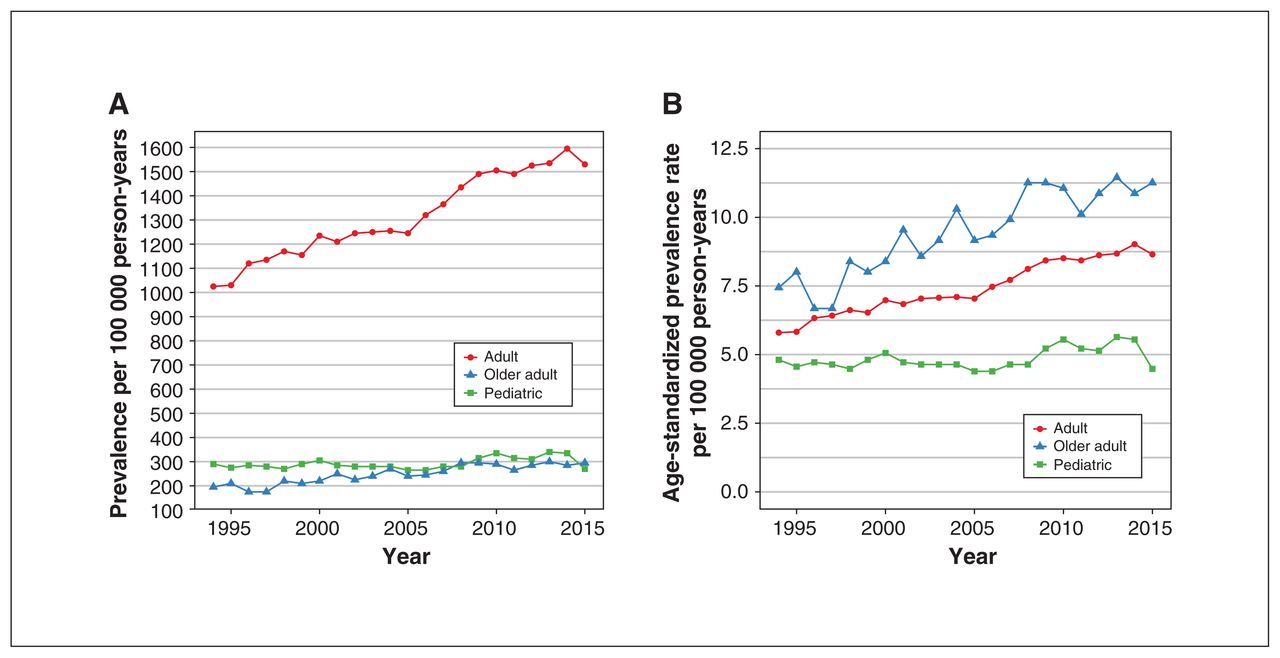
(A) Prevalence per 100 000 person-years of primary malignant central nervous system (CNS) tumours by age category, 1994–2015. (B) Age-standardized prevalence per 100 000 person-years of primary malignant CNS tumours by age category, 1994–2015.
The average disease duration during the study period was 19.7 months in children, 15.6 months in adults and 4.8 months in older adults. At 1 year after diagnosis, fewer males were alive than expected (observed: 765; expected: 819) (p = 0.048). Overall survival was shorter among males than among females.
Trend analyses
Figures 4 depicts trend analyses for the incidence and prevalence of primary malignant CNS tumours by age group. Trend analyses for age-standardized incidence and age-standardized prevalence for primary malignant CNS tumours in the 3 age groups, in addition to all ages for all cancers, are given in Appendix 2 (available at www.cmajopen.ca/content/9/4/E973/suppl/DC1). The pediatric incidence and prevalence, including age-standardized corrections, did not increase over the study period. In the adult and older adult groups, incidence, prevalence and age-standardized corrections all increased significantly over the study period, with the age-standardized incidence among adults increasing at 1.3 APC and that among older adults increasing at 2.0 APC. The age-standardized prevalence of all cancers increased steadily over the study period, whereas there was no significant APC change in the age-standardized incidence of all cancers overall, with a significant APC decrease of 1.2 from 2012 to 2017.
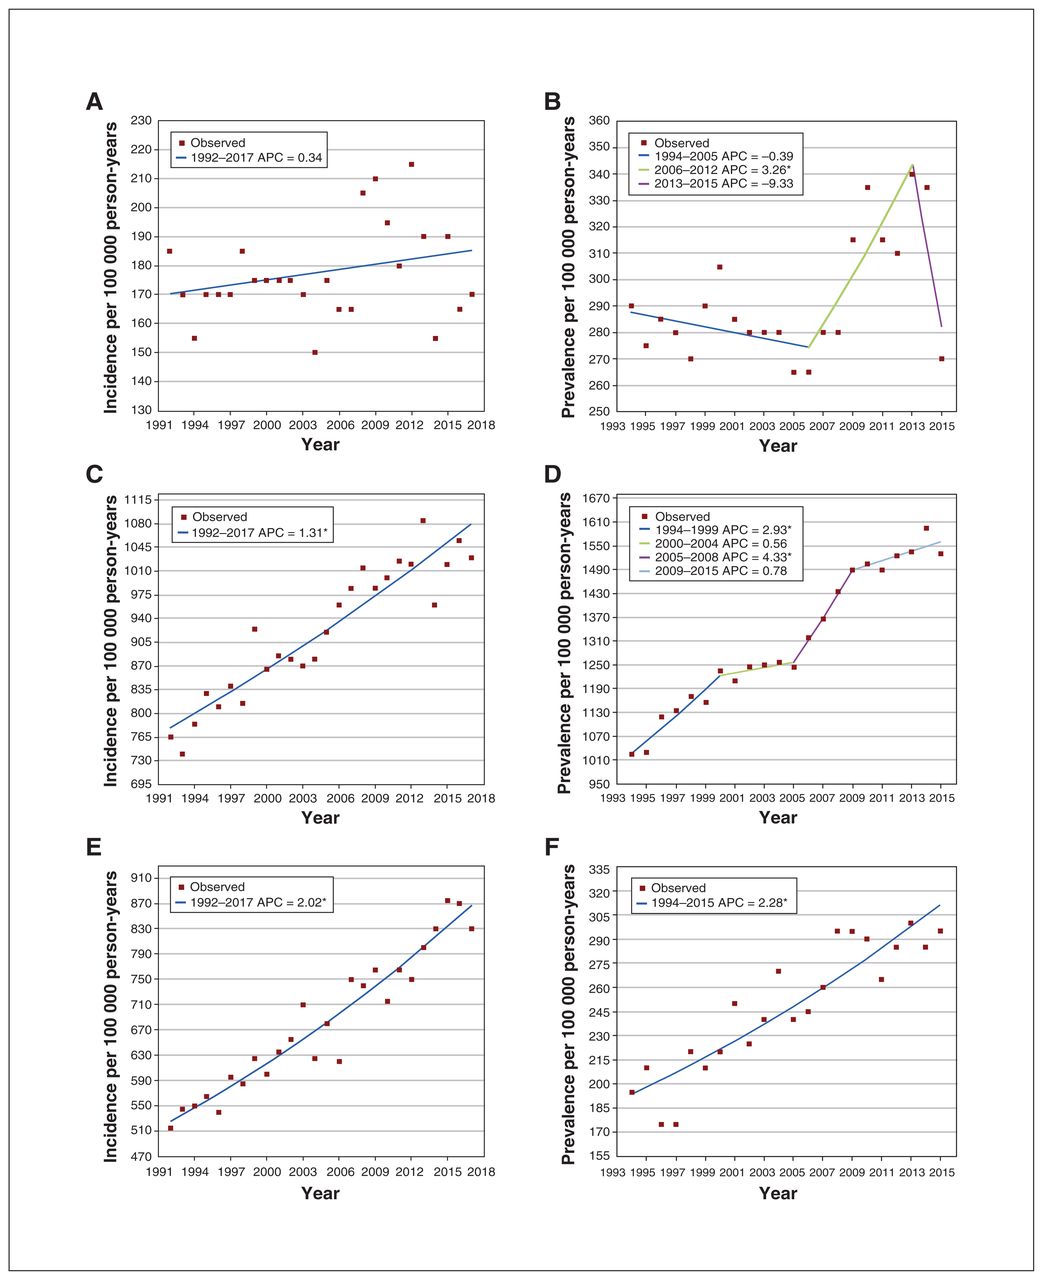
Trend analysis of incidence and prevalence per 100 000 person-years of primary malignant central nervous system tumours for pediatric (A, B), adult (C, D) and older adult (E, F) age groups. Final selected model: (A) 0 joinpoints, (B) 2 joinpoints, (C) 0 joinpoints. (D) 3 join-points, (E) 0 joinpoints, (F) 0 joinpoints. *Indicates that the annual percent change (APC) is significantly different from 0 at the α = 0.05 level.
Interpretation
In 1992–2017, the overall average age-standardized incidence of primary malignant CNS tumours in Canada was 7.9 per 100 000 person-years. The overall age-standardized prevalence was 7.6 per 100 000 person-years and 8.4 per 100 000 person-years for adults more than 19 years old. The overall incidence of primary malignant CNS tumours increased by 37.5% during the study period, and the overall prevalence increased by 40.5%. Adults and older adults accounted for the majority of incidence and prevalence, with children representing only 10.0% of incidence and 15.8% of prevalence. Males were disproportionately affected, with a higher incidence and prevalence and decreased survival 1 year after diagnosis compared to females. Raw incidence and prevalence rates were highest in adults, but the age-standardized incidence and prevalence rates were highest in older adults. Trend analysis showed increases in age-standardized incidence among both adults and older adults, no change in pediatric age-standardized incidence, and no change in all-cancer age-standardized incidence, with a decreasing trend from 2012 onward.
Our average age-standardized incidence of 7.9 per 100 000 person-years is similar to the Brain Tumour Registry of Canada rate of 8.4 per 100 000 person-years from 2010 to 2015 for 4 provinces.2 However, Brenner and colleagues12 recently published projected cancer estimates for Canada for 2020 using the same source data we used and predicted an age-standardized incidence of primary malignant CNS tumours of 7.1 per 100 000 person-years. Similarly, Demers and colleagues13 reported a significant decrease in the incidence of primary malignant CNS tumours of 1.9% in Canadian males between 2009 and 2015 but no significant difference between 1984 and 2009. Other reports have also shown decreasing overall cancer incidence in Canada in recent years, with speculation that this was largely due to a decrease in lung cancer incidence.13,14
Our average age-standardized prevalence of CNS tumours of 8.4 per 100 000 person-years for adults more than 19 years old for 1994–2015 is lower than the US rate reported by Gittleman and colleagues15 for that age group for 2000–2014, 13.9 per 100 000 person-years. Those authors calculated rates adjusted to the 2000 US population structure; thus, owing to the aging North American population, they may have overestimated the true prevalence because of the use of smaller populations for adults and older adults compared to the actual population.12
Although further data are needed to investigate age-standardized rates, the non–age-adjusted (raw) incidence and prevalence of primary malignant CNS tumours have steadily increased over time. Our findings that the incidence of these tumours increased by 37.5% between 1992 and 2017 and the prevalence increased by 40.5% between 1994 and 2015 are likely due to a combination of factors, including a growing population, higher rates of diagnosis due to improved imaging modalities, better surgical and hospital care, and advances in molecular diagnostics and systemic therapy, resulting in increased therapeutic options.15–17 Adults, especially adult males, had the highest incidence and prevalence of malignant CNS tumours and shorter survival than females. These findings are in keeping with previously published data and are likely driven by malignant gliomas.2,16
Despite a recent decrease in cancer incidence,13,14 the overall cancer burden in Canada is expected to rise given the increasing and aging population.12 Our results show that this recent trend has not affected CNS tumours; in fact, the incidence and prevalence of these diseases steadily increased from 1992 to 2017. Both before and during the COVID-19 pandemic, delays in symptom identification and referral time to a specialist have led to an increased burden on patients with brain tumours and their caregivers.18,19 Future directions include continued epidemiologic monitoring of these diseases to assist health care, policy and advocacy decisions, and increased awareness and surveillance measures including timely neurologic imaging and referral in order to prioritize patient-centred quality of life and provide the best care to these patients.
Limitations
Owing to the variability in annual rates and differences in reporting practices over time and between regions, there is a possibility that some of our results may be explained by improved diagnostic guidelines and legislation. For example, legislation passed in Canada in 2007 mandated reporting of all primary brain tumours, although initially there were gaps in the collection and reporting of these data because of lack of funds.20 In addition, the World Health Organization has released 3 different brain tumour classification guidelines since 2000 (2000, 2007, 2016), including the addition of molecular markers in diagnoses and the removal of outdated diagnoses in an attempt to improve diagnostic accuracy and decrease the number of misclassified brain tumours.21 This has also led to the inclusion and exclusion of diagnoses that classically may have been considered as either malignant or nonmalignant but are no longer considered as such. The CCR database lacks survival data, so we were unable to provide a measure of the male–female survival difference other than the reported p value. The CCR database also lacks Quebec data from 2011 onward owing to changes in reporting status for that province. Finally, it is important to note that the same publicly available database has been used in all of the Canadian studies and that this database and its estimates are likely becoming more accurate over time as the field of neuro-oncology and reporting practices evolve.
Conclusion
The incidence and prevalence of primary malignant CNS tumours increased steadily from 1992 to 2017. Males and older adults were disproportionately affected. Increased awareness and resources are needed to help address this disparity and provide support to these patient groups. We hope that our findings will help guide future allocation of health care resources in order to improve patient care and quality of life.
Footnotes
Competing interests: None declared.
This article has been peer reviewed.
Contributors: Gelareh Zadeh conceived and designed the study. Mathew Voisin acquired and analyzed the data. Mathew Voisin and Sanskriti Sasikumar drafted the manuscript, with contributions from Alireza Mansouri. Mathew Voisin and Sanskriti Sasikumar interpreted the data. All of the authors revised the manuscript critically for important intellectual content, approved the final version to be published and agreed to be accountable for all aspects of the work.
Funding: There was no funding for this study.
Data sharing: All portions of the data are publicly available and can be downloaded through Statistics Canada: Canadian Cancer Registry at https://www.statcan.gc.ca/eng/about/pia/ccr/.
Supplemental information: For reviewer comments and the original submission of this manuscript, please see www.cmajopen.ca/content/9/4/E973/suppl/DC1.
This is an Open Access article distributed in accordance with the terms of the Creative Commons Attribution (CC BY-NC-ND 4.0) licence, which permits use, distribution and reproduction in any medium, provided that the original publication is properly cited, the use is noncommercial (i.e., research or educational use), and no modifications or adaptations are made. See: https://creativecommons.org/licenses/by-nc-nd/4.0/
References
- © 2021 CMA Joule Inc. or its licensors
In this issue

Article tools


