


Abstract
Background: Diabetes, a leading cause of visual impairment, is on the rise in Canada. We assessed trends in the prevalence of visual impairment among people in Canada with and without diabetes to inform the development of strategies and policies for the management of visual impairment.
Methods: We analyzed self-reported data from respondents aged 45 years and older in 7 cycles of nationwide surveys (National Population Health Survey and Canadian Community Health Survey) from 1994/95 to 2013/14. The age- and sex-standardized prevalence of visual impairment was calculated. We assessed comparisons by levels of education and income, using sex-standardized prevalence owing to sparse data.
Results: Among people in Canada with diabetes, the age- and sex-standardized prevalence of visual impairment was 7.37% (95% confidence interval [CI] 5.31%–9.43%) in 1994/95 and 1996/97 combined, decreasing to 3.03% (95% CI 2.48%–3.57%) in 2013/14, giving a standardized prevalence ratio of 0.41 (95% CI 0.30–0.56) comparing 2013/14 with 1994/95 and 1996/97 combined. Among people in Canada without diabetes, visual impairment prevalence decreased from 3.72% (95% CI 3.31%–4.14%) in 1994/95 and 1996/97 combined to 1.69% (95% CI 1.52%–1.87%) in 2013/14, with a standardized prevalence ratio of 0.45 (95% CI 0.40–0.52). Decreased sex-standardized prevalence of visual impairment was observed among people with high and low education levels and incomes among those with and without diabetes.
Interpretation: Visual impairment prevalence was roughly 2 times higher among those with versus without diabetes in all survey years; from 1994 to 2014, visual impairment prevalence decreased among those with and without diabetes irrespective of education and income levels. These results suggest effective collective efforts by clinicians, researchers, the public and government.
Visual impairment substantially affects individuals’ independence and quality of life, and risk of accidents, injuries, falls and depression.1–4 Diabetes is a leading cause of visual impairment resulting from diabetic retinopathy and diabetic macular edema.5 In Canada, the incidence of diabetes fluctuated and the prevalence of diabetes increased 37.3% between 2003/04 and 2013/14.6 In 2016/17, the number of people in Canada living with diabetes was 3.2 million, which increased to 5.7 million in 2022.7,8 Contributing factors to this increase include people in Canada with diabetes now living longer and the growth and aging of the Canadian population.6
Given the fast-rising prevalence of diabetes, it is important to know whether the prevalence of visual impairment has also increased so that strategies and policies for prevention and management of visual impairment can be developed. We sought to assess time trends in visual impairment prevalence among people in Canada with and without diabetes from 1994/95 to 2013/14 and to determine whether the trends were similar among people in Canada with different levels of education and income.
Methods
This study was set in 10 Canadian provinces (Alberta, British Columbia, Manitoba, New Brunswick, Newfoundland and Labrador, Nova Scotia, Ontario, Prince Edward Island, Quebec and Saskatchewan). Data were collected via a series of cross-sectional surveys conducted in 1994/95, 1996/97, 1998/99, 2000/01, 2008/09, 2009/10 and 2013/14 among people in Canada aged 45 years and older.
Data sources and participants
Data were from 7 cycles of nationwide surveys: the 1994/95, 1996/97 and 1998/99 cycles of the National Population Health Survey (NPHS) and the 2000/01, 2008/09 Healthy Aging, 2009/10 and 2013/14 cycles of the Canadian Community Health Survey (CCHS).
The CCHS and NPHS (household cross-sectional component) are cross-sectional surveys with participants randomly selected across the country by Statistics Canada, using a multi-stage stratified cluster design with 1 person being selected per household.9,10 The NPHS targeted household residents of all ages and the CCHS targeted Canadians aged 12 years and older living in private dwellings, except for the CCHS 2008/09 Healthy Aging, which targeted Canadians aged 45 years and older. Data in NPHS and CCHS were collected using computer-assisted interviews. Overall response rates ranged from 69.7% to 92.8% for the NPHS and from 72.3% to 87.3% for the CCHS.10–15 Only respondents aged 45 years and older were included since visual impairment is an age-related condition and the CCHS 2008/09 Healthy Aging included only individuals aged 45 years and older.16
Outcome measure
The study outcome was self-reported visual impairment, obtained using the Health Utilities Index Mark 3 (HUI3) in the NPHS and CCHS.17–19 The HUI3 has a reliability of κ = 0.728.17 Although visual impairment was not clinically measured, it is the individual’s presenting or habitual vision, not their best-corrected visual acuity measured in the ideal clinic settings, that reflects their real-life vision challenges.20,21
The HUI3 asks the following questions:
Are you usually able to see well enough to read ordinary newsprint without glasses or contact lenses?
Are you usually able to see well enough to read ordinary newsprint with glasses or contact lenses?
Are you able to see at all?
Are you able to see well enough to recognize a friend on the other side of the street without glasses or contact lenses?
Are you usually able to see well enough to recognize a friend on the other side of the street with glasses or contact lenses?
Replies were categorized by Statistics Canada into 5 mutually exclusive groups:18 (i) no visual problems; (ii) problems corrected by lenses (distance, close or both); (iii) problems seeing distance not corrected; (iv) problems seeing close not corrected; and (v) problems seeing close and distance not corrected, or no sight at all.
In this analysis, vision problems not corrected by lenses for close vision, distance vision, or both, or no sight at all (i.e., the combination of groups [iii], [iv] and [v]) were considered as having self-reported visual impairment. Groups (i) and (ii) were categorized as not having self-reported visual impairment.
Diabetes measure
Participants who self-reported that they had (or did not have) diabetes diagnosed by a health professional were considered as having diabetes (or not having diabetes).
Other measures
Information on the highest level of education attained by participants was obtained through a series of questions and was categorized by Statistics Canada into 4 levels: (1) less than secondary school graduation; (2) secondary school graduation, no postsecondary; (3) some postsecondary education; and (4) postsecondary certificate/diploma or university degree. We further consolidated participants into low ([1] and [2] above) and high ([3] and [4] above) levels to avoid sparse data. Information on total household income was collected by Statistics Canada via income categories or an estimate. We grouped the income data into low (below middle) and middle–high (middle or higher) levels for adequate data analysis.
Statistical analysis
We calculated prevalence estimates by diabetes status and level of education and household income. Survey weights generated similarly by Statistics Canada for the NPHS and CCHS were used in all analyses to adjust for various factors.23 Weighted prevalence estimates and 95% confidence intervals (CIs) were directly age- and sex-standardized to the 2016 Canadian census to allow for valid comparisons.24 For analyses stratified by education and income, only sex-standardized prevalence was calculated owing to sparse data not meeting the data release rules and questionable test results when stratifying by both age and sex. We calculated standard errors and 95% CIs of prevalence estimates using the bootstrap weights with 500 subsamples drawn by Statistics Canada. Owing to small cell sizes, the 1994/95 and 1996/97 cycles of the NPHS and the 1998/99 and 2000/01 cycles of the NPHS and CCHS were combined (termed 1994~1997 and 1998~2001, respectively) for calculating overall prevalence estimates and education-stratified estimates. 25 For similar reasons, the 1998/99 cycle of the NPHS was combined with the 2000/01 cycle of the CCHS for calculating income-stratified estimates. Standardized prevalence ratios and 95% CIs were calculated to compare the visual impairment prevalence in 2013/14 versus the combined 1994~1997 data.26 We assessed additive and multiplicative interaction for education–diabetes and income–diabetes on visual impairment prevalence.27 Answers of “Don’t know” or “Refuse” were treated as missing values.
Ethics approval
Statistics Canada obtained informed consent from all survey participants. The University of Toronto Research Ethics Board approved this study (no. 36562).
Results
The characteristics of participants are shown in Table 1. The weighted number of people in Canada with diabetes aged 45 years and older increased from 607 100 in 1994/95 to 1 772 200 in 2013/14. The weighted number of individuals with visual impairment decreased from 57 200 in 1994/95 to 53 900 in 2013/14 for people with diabetes and from 344 400 in 1994/95 to 205 900 in 2013/14 for those without diabetes. Weighted missing values for included variables ranged from 0% for age and sex to 18.9% for income. Unweighted missing values were 17–1224 (0.00%–0.02%) for visual impairment and 1–127 (0.00%–0.00%) for diabetes.
Weighted characteristics of participants aged 45 years and older in the National Population Health Survey and the Canadian Community Health Survey, with and without diabetes, 1994–2014
The age- and sex-standardized prevalence of visual impairment among people with and without diabetes is shown in Figure 1. In all survey years, visual impairment prevalence was about 2 times higher among people with diabetes than those without. Overall, a decreasing visual impairment prevalence was observed among the groups with and without diabetes. Among those with diabetes, the visual impairment prevalence decreased from 7.37% (95% CI 5.31%–9.43%) in the combined 1994~1997 to 3.03% (95% CI 2.48%–3.57%) in 2013/14, giving a standardized prevalence ratio of 0.41 (95% CI 0.30–0.56) for 2013/14 versus the combined 1994~1997. Among those without diabetes, the visual impairment prevalence decreased from 3.72% (95% CI 3.31%–4.14%) in the combined 1994~1997 to 1.69% (95% CI 1.52%–1.87%) in 2013/14, with a standardized prevalence ratio of 0.45 (95% CI 0.40–0.52) for 2013/14 versus the combined 1994~1997.
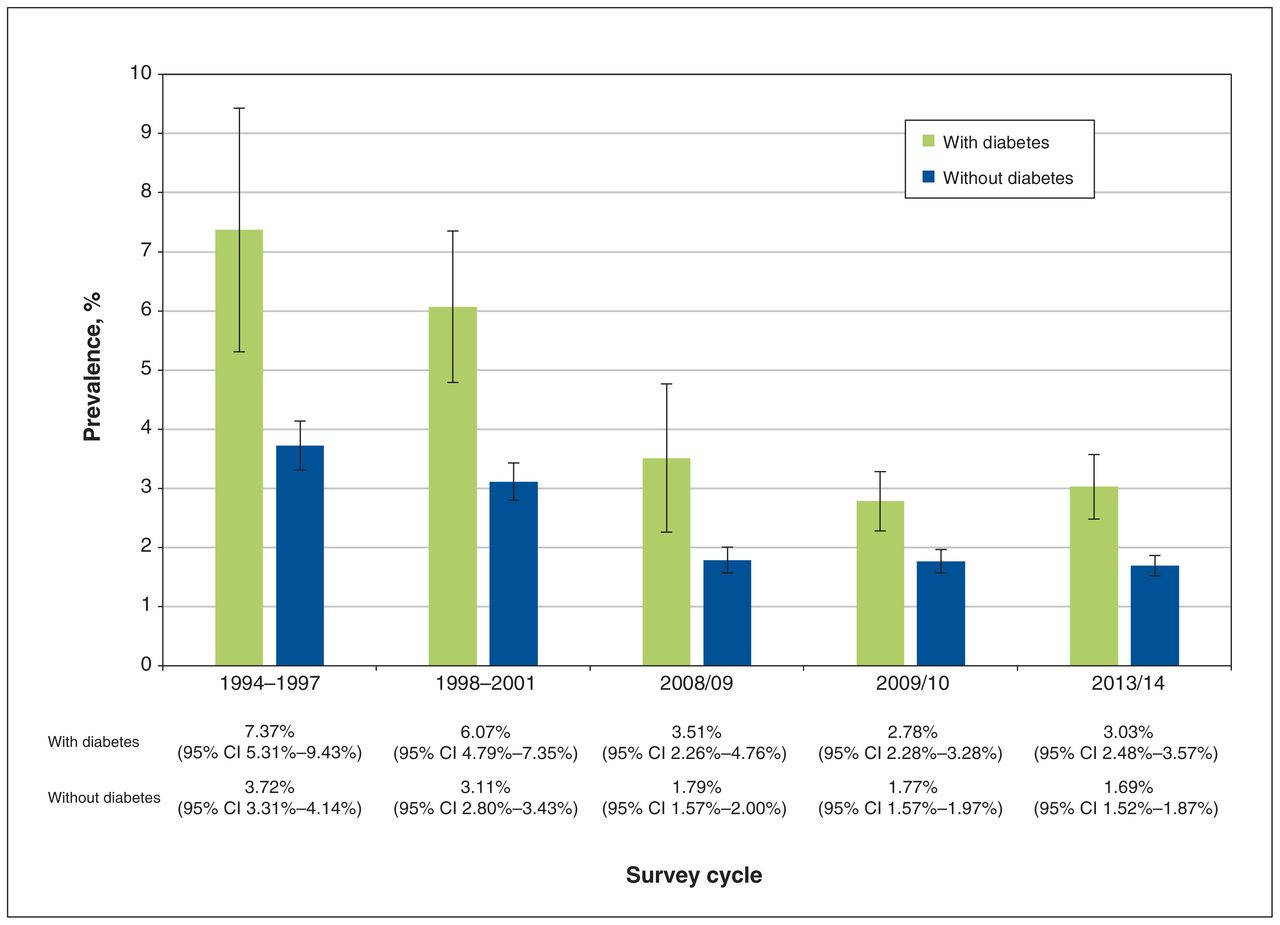
The age- and sex-standardized prevalence of visual impairment in the 10 Canadian provinces from 1994 to 2014. Note: CI = confidence interval.
Figure 2 shows a decreasing visual impairment prevalence in all subgroups stratified by level of education and diabetes status from 1994 to 2014. In the low-education stratum, the sex-standardized prevalence of visual impairment decreased from 9.96% (95% CI 6.91%–13.02%) in the combined 1994~1997 to 3.57% (95% CI 2.84%–4.29%) in 2013/14 for those with diabetes, and from 4.16% (95% CI 3.52%–4.79%) in the combined 1994~1997 to 2.18% (95% CI 1.87%–2.48%) in 2013/14 for those without diabetes. In the high-education stratum, the visual impairment prevalence similarly decreased from 6.04% (95% CI 2.20%–9.88%) in the combined 1994~1997 to 3.06% (95% CI 2.21%–3.91%) in 2013/14 for those with diabetes, and from 2.68% (95% CI 2.19%–3.17%) in the combined 1994~1997 to 1.21% (95% CI 1.01%–1.41%) in 2013/14 for those without diabetes.
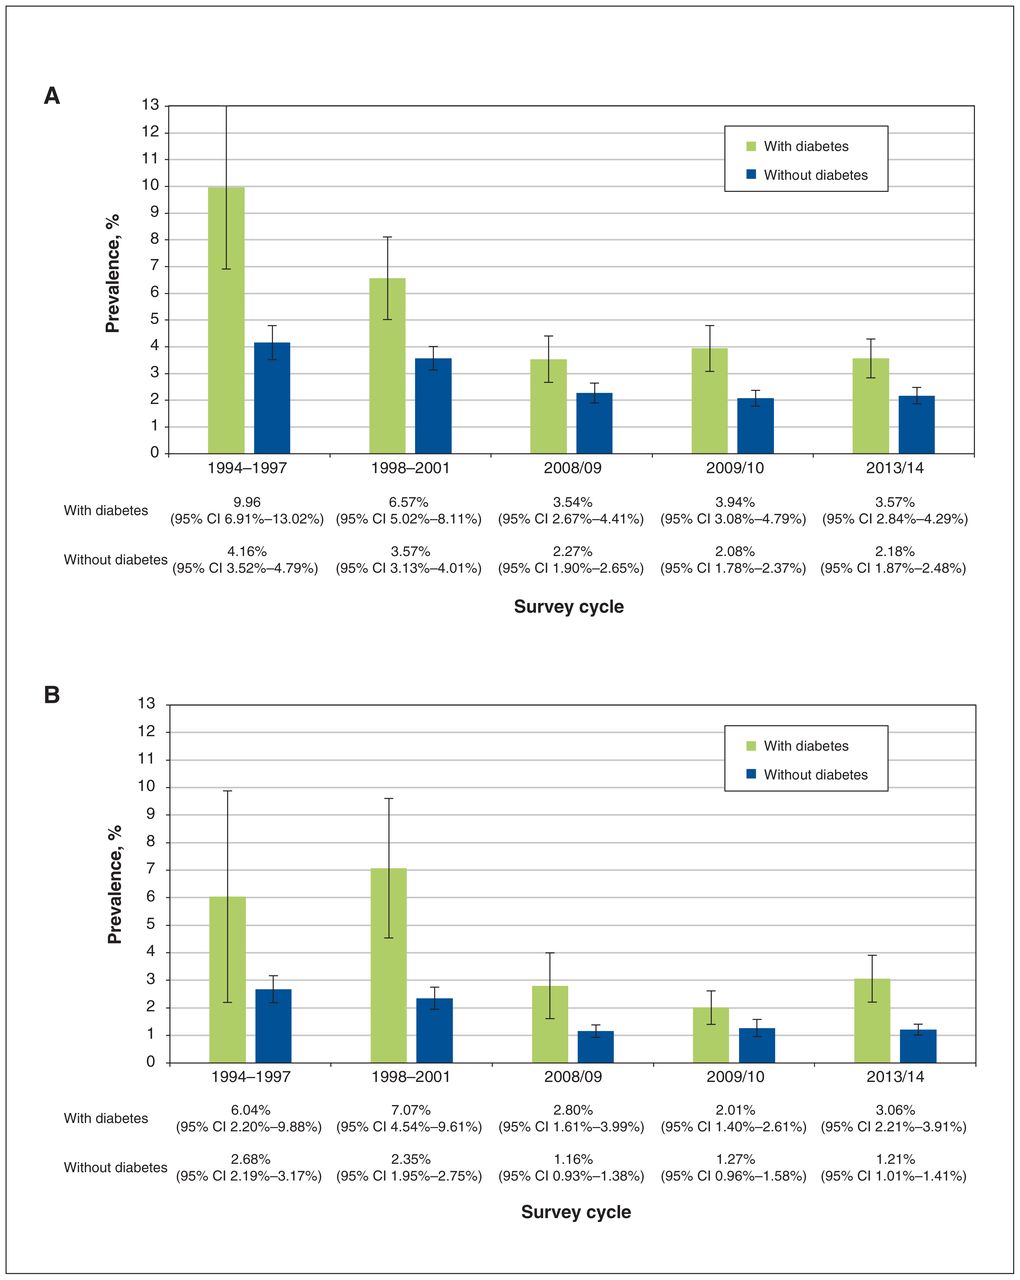
The sex-standardized prevalence of visual impairment in the 10 Canadian provinces stratified by education levels from 1994 to 2014. (A) Low level of education. (B) Middle–high level of education. Note: CI = confidence interval.
Figure 2 also shows that the sex-standardized prevalence of visual impairment was highest in people with low education levels and diabetes, and lowest in those with high education levels and no diabetes in all survey years. Evaluations of interactions regarding the joint effects of low levels of education and having diabetes on visual impairment prevalence are shown in Table 2. In 2013/14, the observed standardized prevalence ratios for the joint presence of low level of education and diabetes were smaller than the expected standardized prevalence ratio from both the additive (2.36 v. 2.82) and multiplicative model (2.95 v. 4.56), indicating the presence of negative additive and negative multiplicative interaction. However, positive additive interactions were present in other years for education–diabetes on visual impairment prevalence. Multiplicative interactions were negative in 3 of 5 and not present in 2 of 5 assessments.
The observed and expected joint standardized prevalence ratio from the additive and multiplicative models in assessing the joint effects of diabetes and level of education and level of household income on the prevalence of visual impairment
After stratification by household income level and diabetes status, a decreased visual impairment prevalence over time was observed (Figure 3). The highest sex-standardized prevalence of visual impairment was found in Canadians with low level of income and diabetes, and the lowest was found in those with middle–high level of income and no diabetes in all survey years. Evaluations of interactions between the joint presence of low level of household income and diabetes on visual impairment prevalence are shown in Table 2. In 2013/14, there was evidence of positive additive interaction (standardized prevalence ratio observed 3.39 v. expected 2.86). However, negative additive interactions were observed for other years (e.g., 2008/09).
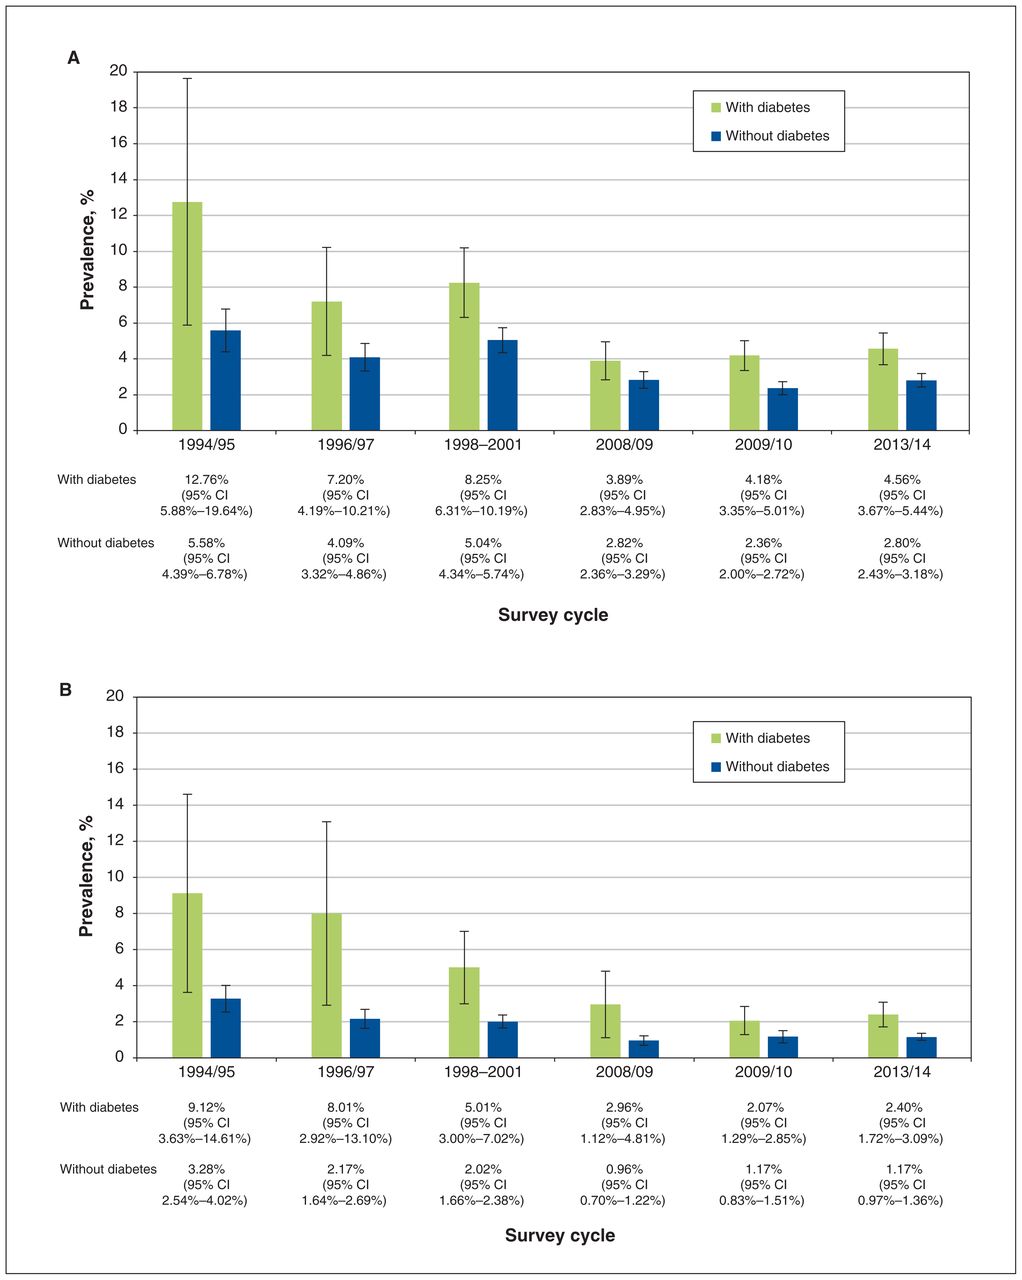
The sex-standardized prevalence of visual impairment in the 10 Canadian provinces stratified by household income levels from 1994 to 2014. (A) Low level of household income. (B) Middle–high level of household income. Note: CI = confidence interval.
The visual impairment prevalence among those with missing household income data showed a similar decreasing trend over time (Appendix 1, Supplementary Table S1, available at www.cmajopen.ca/content/11/6/E1125/suppl/DC1).
The visual impairment prevalence stratified by age, education (or household income), and diabetes status are presented in Appendix 1, Supplementary Tables S2 and S3.
Interpretation
This study assessed visual impairment trends among people in Canada with and without diabetes over 2 decades. We report that whereas the number of participants who reported having diabetes nearly tripled from 1994/95 to 2013/14, the proportion of people with visual impairment decreased among those with and without diabetes. Adjusting for age and sex, visual impairment prevalence decreased by more than half (standardized prevalence ratio 0.41 for those with diabetes and 0.45 for those without). However, in 2009/10 and 2013/14, the visual impairment prevalence seems to have leveled off (Figure 1). Sex-adjusted analyses stratified by education and income levels also showed a decreasing trend from 1994 to 2014. Furthermore, we report the visual impairment prevalence was about 2 times higher among people with diabetes than those without in all survey years. The highest visual impairment prevalence was found in people with diabetes and low levels of education or income, and the lowest was found among those without diabetes and with middle–high levels of education or income. In 2013/14, a positive additive interaction between diabetes and low levels of household income on visual impairment prevalence was noted, suggesting that visual impairment interventions targeting those with diabetes and low levels of income may yield a benefit larger than expected. However, this additive interaction varied by year. Caution should be taken when applying this strategy to the most recent years.
The decreased prevalence of visual impairment we report complements other reports of visual impairment.28,29 In Europe, a meta-analysis involving individuals aged 55 years and older reported that prevalence of visual impairment decreased from 2.22% in 1991–2006 to 0.92% in 2007–2012.28 Another meta-analysis similarly reported that the age-adjusted prevalence of visual impairment decreased from 1990 to 2015 globally.29 However, these reports did not distinguish between people with and without diabetes, and used pooled data from countries with different health care systems. In 2022, Purola and colleagues reported that the visual impairment prevalence and incidence due to diabetic retinopathy in the Finish population peaked in the 1990s and decreased from 1996 to 2019.30 Using Canadian data, we report that visual impairment prevalence decreased among people with and without diabetes from 1994 to 2014, irrespective of their level of education and income. The decreased visual impairment prevalence likely reflects the collective efforts by clinicians, researchers, the public and government to prevent vision loss, including better understanding of diabetic eye diseases,31–33 better blood-glucose control,34–38 recent effective treatment for advanced diabetic retinopathy and technology (e.g., optical coherence tomography) for early detection of diabetic retinal pathologies,39–44 government coverage for new advancements and various initiatives for increased diabetic eye screening.45–47
Our results are also in accordance with studies that reported a significantly higher visual impairment prevalence among people with diabetes than those without.48–50 Despite a decreased visual impairment prevalence over time, the prevalence of visual impairment in 2013/14 was still significantly higher among Canadians with diabetes versus those without, demonstrating that diabetes was still a major cause of visual impairment in Canada in 2013/14. Preventing and treating diabetes and diabetic retinopathy must remain a priority in Canada.
Limitations
This study has limitations. We described visual impairment trends based on data from cross-sectional surveys at different times. Estimates from combining cycles represent an “artificial” population made up of populations surveyed at different times.25
Information on visual impairment was self-reported using HUI3, which may be susceptible to misclassifications, although the HUI3 performed well over other visual function questionnaires and has been successfully used in prior publications.51–55
Self-reported diabetes has excellent specificity (87.8%–98.6%) but only moderate sensitivity (41.5%–70.4%) in studies from China, Japan and Brazil.56–58 Extrapolating the reported moderate sensitivity to people in Canada entails misclassification of some individuals with diabetes as not having diabetes, causing an overestimation of visual impairment prevalence among people in Canada without diabetes. We are not aware that the validity of self-reported diabetes changes with time. Therefore, misclassification of self-reported diabetes would likely not affect the decreasing trend reported.
Self-reported diabetes cannot distinguish between type 1 and type 2 diabetes.
The analysis excluded individuals residing in the 3 territories, those living on reserves and those not in private dwellings. The most recent available data on visual impairment is from the CCHS 2013/14 owing to survey content changes. Consequently, our conclusions may not be generalizable to Canadians living in the 3 territories or Indigenous communities, nor would they be applicable if extrapolated beyond 2014. Nonetheless, our results provide a valuable 20-year historical perspective for future comparisons.
Whereas we observed trends in visual impairment prevalence by age, we could not age-standardize prevalence of visual impairment when comparing by levels of education and income owing to sparse data. Our estimates for education and income should be interpreted with caution.
There may have been a few individuals who were randomly selected to participate in more than 1 survey cycle. Pooling the NPHS 1994/95 and 1996/97 cycles may have resulted in the inclusion of some repeat participants between 2 cycles. However, the chance of being selected for multiple surveys is low and the possibility of rejecting participation in multiple surveys, if selected, is high because of the burdens of answering the long questionnaire. In addition, survey weights were used to represent different groups in the population across different cycles. These factors may minimize the impact of repeated participation in surveys by the same respondents.
Conclusion
Visual impairment prevalence in Canada is higher among people with diabetes than those without, and decreased from 1994 to 2014 overall. The decreasing trend was observed in all subgroups stratified by diabetes–education and diabetes–income but was attenuated in 2009/10 and 2013/14. Efforts for visual impairment reduction should continue to focus on diabetes education, prevention, treatment and diabetic eye examinations.
Acknowledgements
The authors acknowledge that the data used in this publication are from the National Population Health Survey in 1994/95, 1996/97, 1998/99, and the Canadian Community Health Surveys in 2000/01, 2008/09, 2009/10, 2013/14. Both surveys were run by Statistics Canada. The authors thank all participants of these surveys and the staff from Statistics Canada who assisted in the survey data collection and management.
Footnotes
Competing interests: Ya-Ping Jin reports research grant support from the Lindenfield Family Research Grant for this study, and from the Glaucoma Research Society of Canada outside the submitted work. No other competing interests were declared.
This article has been peer reviewed.
Contributors: James Im led the data analyses, drafted and revised the manuscript, and prepared tables and figures. Ya-Ping Jin, Graham Trope, Yvonne Buys, Peng Yan, Michael Brent and Sophia Liu conceived the study. Ya-Ping Jin designed the study, acquired data access, resolved analysis-related issues and led the manuscript revision. All authors contributed to data interpretation, revised the manuscript critically for important intellectual content, gave final approval of the version to be published and agreed to act as guarantors of this work and take responsibility for the contents of the article.
Funding: This research was supported by funds from the Canadian Research Data Centre Network from the Social Science and Humanities Research Council, the Canadian Institute for Health Research, the Canadian Foundation for Innovation and Statistics Canada.
Disclaimer: Although the research and analysis are based on data from Statistics Canada, the opinions expressed do not represent the views of Statistics Canada or the Canadian Research Data Centre Network.
Data sharing: Access to this third-party data set is through the Statistics Canada Research Data Centres (RDCs) Program, which has centres at universities across Canada. Research Data Centres are operated under the provisions of Canada’s Statistics Act, which states that persons retained under contract to perform special services under this act are deemed to be persons employed under this act while performing those services, in accordance with all the confidentiality rules. Anyone may apply to access the data by submitting a research proposal that justifies the need for access to confidential microdata to address a question that has relevance for the Canadian population. On approval, researchers undergo a deeming process and a contract is granted. Thus, access to the data is granted on a need-to-know basis. For those interested in obtaining access to these data sets, detailed contact information and application processes to gain access and guidelines to use RDC data can be found at https://www.statcan.gc.ca/eng/rdc/process.
Meeting presentation: The study abstract was presented at the Association for Research in Vision and Ophthalmology Annual Meeting in May 2021 and the Canadian Ophthalmological Society Annual Meeting in June 2021, both presented online owing to the COVID-19 pandemic.
Supplemental information: For reviewer comments and the original submission of this manuscript, please see www.cmajopen.ca/content/11/6/E1125/suppl/DC1.
This is an Open Access article distributed in accordance with the terms of the Creative Commons Attribution (CC BY-NC-ND 4.0) licence, which permits use, distribution and reproduction in any medium, provided that the original publication is properly cited, the use is noncommercial (i.e., research or educational use), and no modifications or adaptations are made. See: https://creativecommons.org/licenses/by-nc-nd/4.0/
References
- © 2023 CMA Impact Inc. or its licensors
In this issue

Article tools


Related Articles
Cited By...
- No citing articles found.